Description
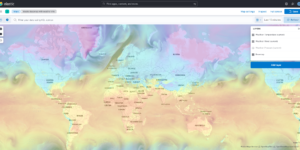
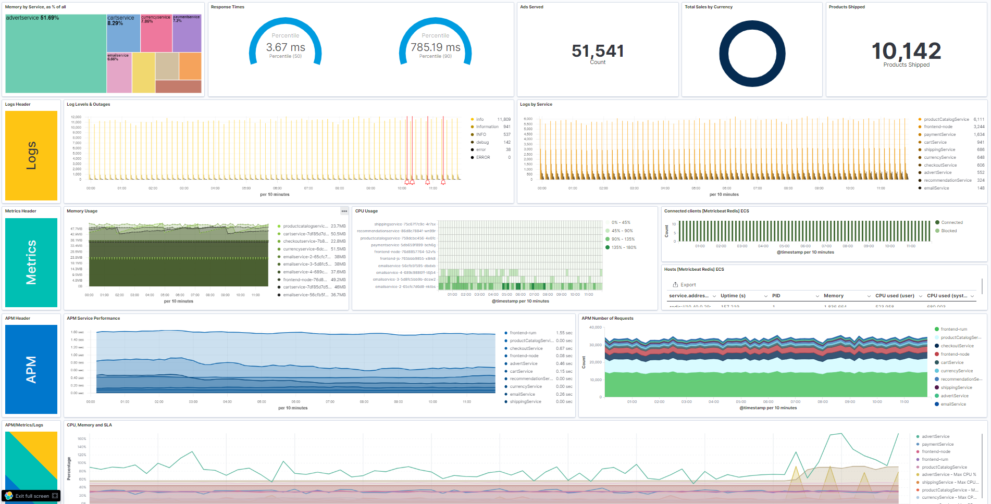
The Observability Kibana Dashboard combines Metrics, Logs, APM data, uptime information and Business KPIs in one single dashboard. This is great to get a first high level view on all pillars of Observability.
Observability describes techniques in how to monitor modern IT applications and infrastructure. The basic concept is to bring all relevant information together in one plattform to be able to correlate the different data sources. The ability to see the performance impact of a lack of ressources in the underlaying infrastructure is crucuial to the success for any IT application.
In addition to that observability helps to improve the quality of your applications by beeing able to detect issues quicker and also find the root cause of any issue in near zero time. This Observability Kibana Dashboard is one great example of how powerful this combination can be.
Here you find more Elastic observability content for Kibana.
Requirements
The following data sources are neccessary to show data:
1.) Filebeat (+ Heartbeat) to show the overall log metrics like
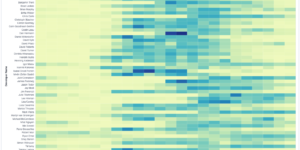
- Log Levels over time made with TSVB (Time series visual builder). This also includes outtages as annotations. To show outtages you also need to collect data from Heartbeat.
- Log Rate per Service. This shows the logs that where created by each service.
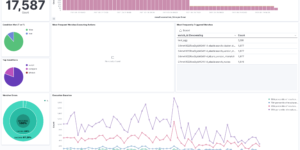
2.) Metricbeat to show the overall infrastructure metrics. The visualizations are based on Kubernetes metrics. If you have Metricbeat, but no Kubernetes you need to change the Kibana visualization a bit.
- For Kubernetes the visualizations show Memory and CPU usage.
- For Redis the visualizations show high level metrics and connected clients.
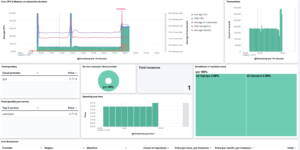
3.) APM (Application Performance Management) data
- APM Service Performance shows performance metrics per application.
- APM Number of requests shows the requests each service has been made over time.
The other Kibana visualizations require some more customizations. Feel free to adapt this Kibana Dashboard example based on your needs,
| Tested versions | 7.x |
| ECS compliant |
You must log in to submit a review.