vega pacman
Demo

Description

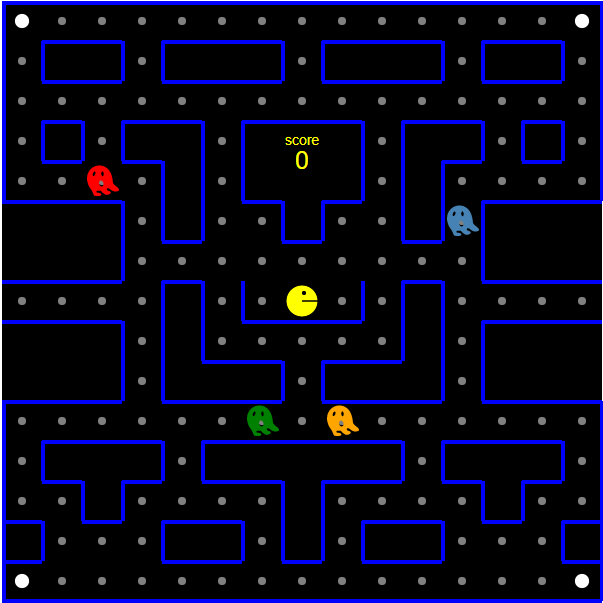
The game of Pac-Man implemented by @mathiastiberghien in Vega. To play the game, use the cursor keys to navigate. Move over the gray circles to power up. The game keeps a high score. We used the example and integrated it into Kibana. Not a lot of value but a lot of fun.

You can learn how this Pac-Man game was created in this tutorial.

Put your high score into the comments!!

Tested versions 7.1, 7.10
ECS compliant No

You must log in to submit a review.

Related downloads

Move to next ILM phase Watcher

This watcher job is moving specific indices based on e.g. disc usage into the next ILM phase.

Office display canvas example

Kibana canvas example showing an office screen with weather, news and stock information

Data flow canvas

Average rating:

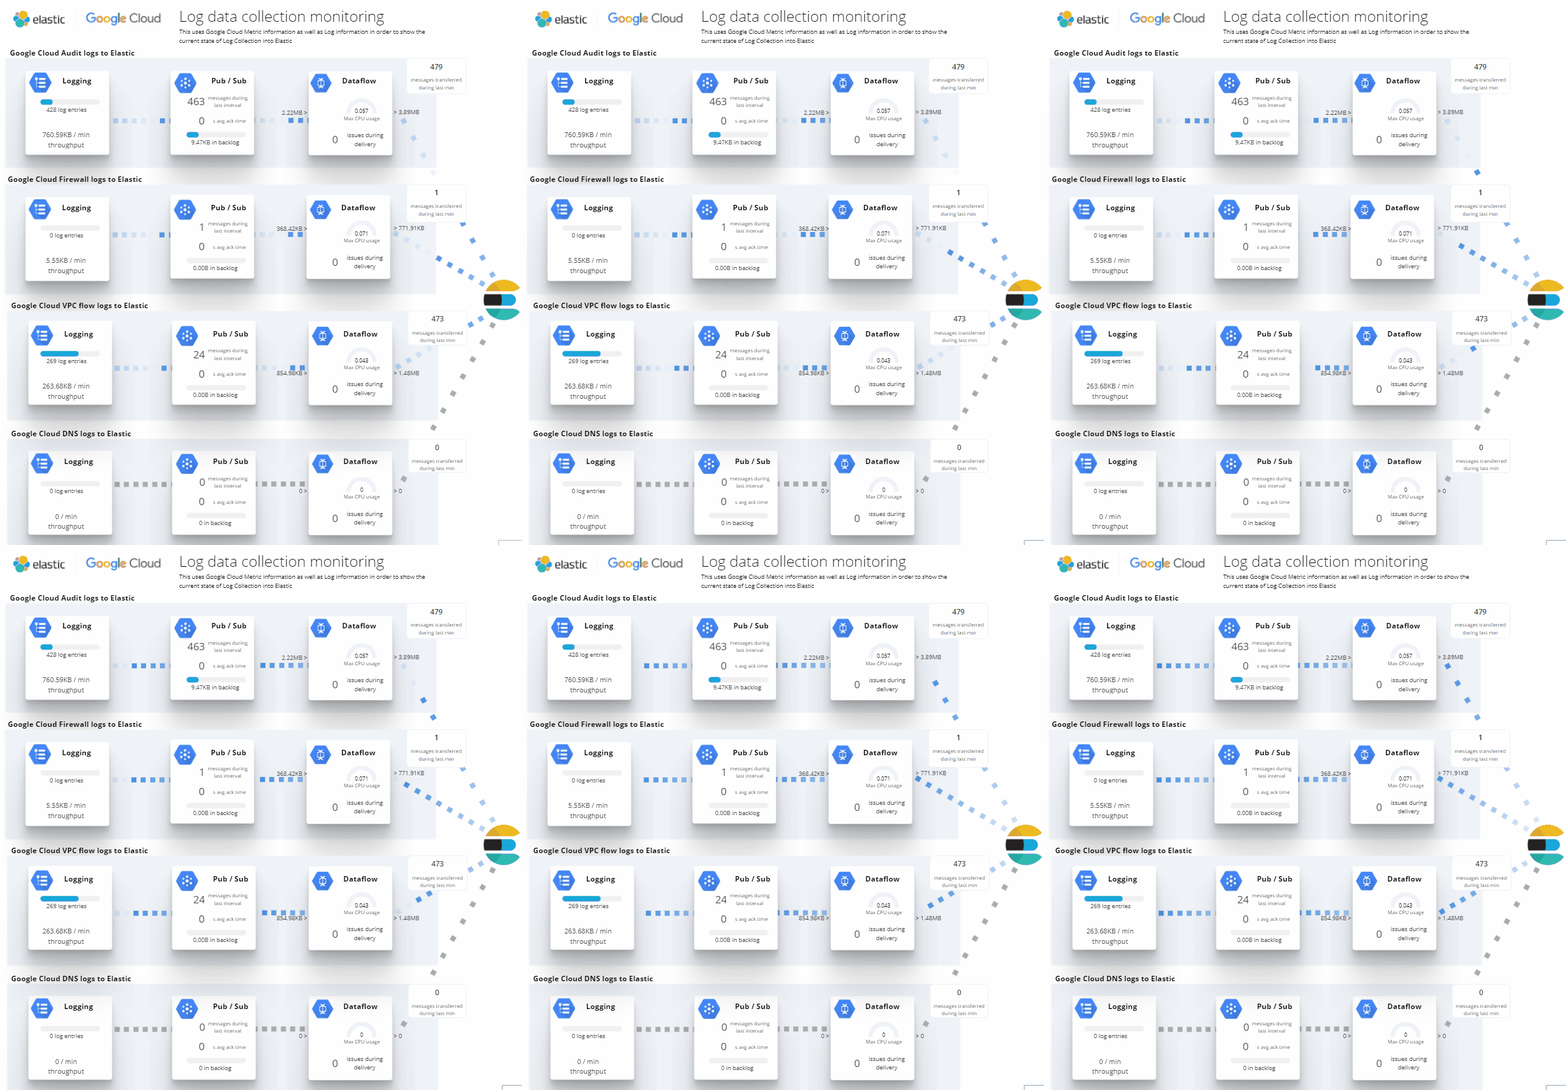
This canvas examples shows some possibilities of how to visualize data flows. Every flow can be activated / deactivated based on your Elasticsearch data.

Elastic Cloud Billing data collection and Kibana dashboard

Pulls Elastic Cloud Billing information from the Billing API then sends it to an Elasticsearch cluster and visualizes the results in Kibana dashboards.

Vega Scatterplot Kibana visualization

A scatterplot visualization made with Vega Lite for Kibana

Sigma Elastic SIEM rules for web server logs

A collection of rules based on the Sigma detection rules for web server looks, e.g. apache, nginx or IIS.

These downloads could be also interesting for you

Azure billing data network

A vega visualization that shows the connection between resource group, resource type and the resource itself based on Elastic agent azure billing data integration.

Crawler dashboard

A Kibana dashboard that visualizes the result of the crawler from Elastic Enterprise Search

Vega Compound Gauge

This is a compund gauge visualization made with Vega. Its very helpful for visualization of percentage values.

APM Services overview canvas

Average rating:

An adaptive turn key canvas example based on Elastic APM data.

AWS VPCFlow Kibana dashboard

Kibana dashboard for AWS VPCFlow log events

Data flow canvas

Average rating:

This canvas examples shows some possibilities of how to visualize data flows. Every flow can be activated / deactivated based on your Elasticsearch data.