vega pacman
Demo

Description

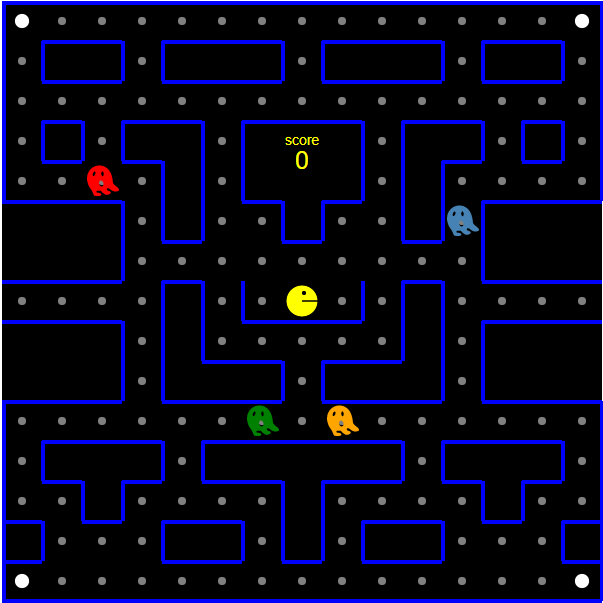
The game of Pac-Man implemented by @mathiastiberghien in Vega. To play the game, use the cursor keys to navigate. Move over the gray circles to power up. The game keeps a high score. We used the example and integrated it into Kibana. Not a lot of value but a lot of fun.

You can learn how this Pac-Man game was created in this tutorial.

Put your high score into the comments!!

Tested versions 7.1, 7.10
ECS compliant No

You must log in to submit a review.

Related downloads

Elastic Cloud Monitoring dashboard

Kibana dashboard that uses the Elastic Cloud monitoring data to provide better insights into what’s happening in your cloud environment.

Ingest Pipeline Monitoring

This Kibana dashboard can be used monitor your ingest pipelines

Threat detection Kibana dashboard

Kibana dashboard example visualizing the results of the Elastic SIEM detection engine

Vega advanced heat map

Vega example to show GitHub commits per author per hour of day.

Detection engine alerts overview dashboard

Average rating:

Kibana Canvas dashboard that shows an aggregated view on the results of the detection engine in Elastic Security.

These downloads could be also interesting for you

Kibana alerting enhancement

This bundle enhances the Kibana alerting experience. Storing all relevant information in indices and visualize the data in dashboards.

Kibana Maps with Open Weather Map

This is the default basemap of Kibana incl. the Open Weather Map tile for temperature, wind and pressure

Google Cloud Log Ingestion dashboard

Canvas Board to analyze the log data collection of Google Cloud via Dataflow using the Google Cloud Metric module data

Crawler dashboard

A Kibana dashboard that visualizes the result of the crawler from Elastic Enterprise Search

Sigma detection rules for proxy server logs

A collection of rules based on the Sigma detection rules for proxy server and web server looks, e.g. zeek or suricata.

PI Hole Logstash Pipeline and Dashboard

A filter for Logstash parsing PI-Hole logs + Dashboard to visualize the data