Elastic RUM dashboard

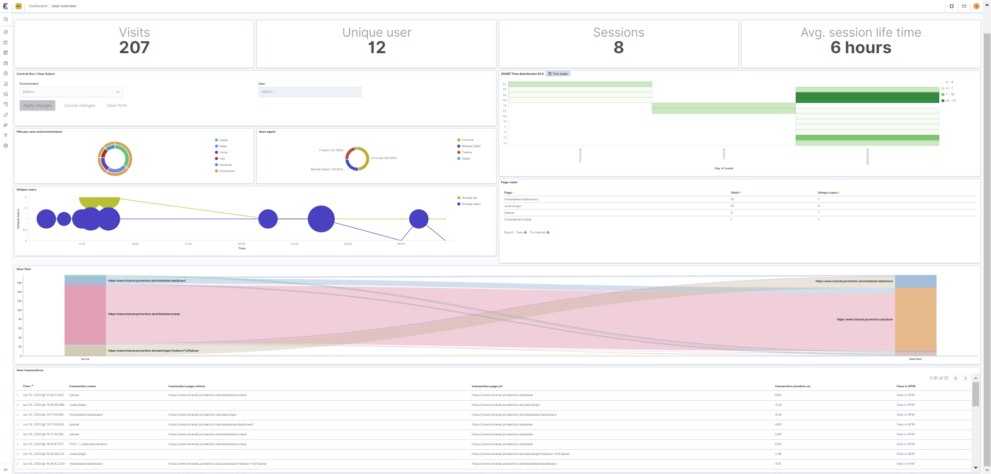
This dashboard improves the visibility into your RUM data collected by the real user monitoring agent of Elastic. It will enable high level user metrics as well as insights into the users journey. Its fully working without much manual effort. Use this real user monitoring Kibana dashboard to get better insight into what your users are doing in your web application.

Highlights:

  1. Visualize a heat map using the hour of day vs. day of week. Enables to quickly see when your application is used mostly.
  2. Visualize the journey of your users including time spend per page.
  3. Visualize the flow of your users. How many users are navigating from one page to the other.

After purchase you will receive a zip file containing the needed files to quickly start using that data.

If you do not know how to use Real User Monitoring with Elastic in general check this.

Tested versions
ECS compliant

You must log in to submit a review.

Related downloads

APM Services overview canvas

Average rating:

An adaptive turn key canvas example based on Elastic APM data.

Lens Conversion Rate

Lens conversion rate for RUM data using Lens Formulas

RUM extension dashboard

This dashboard provide deeper insight into the real user monitoring data collected by Elastic RUM.

These downloads could be also interesting for you

Observability Kibana Dashboard

A single pane of glass dashboard for Logs, Metrics, APM data and business KPIs.

RUM extension dashboard

This dashboard provide deeper insight into the real user monitoring data collected by Elastic RUM.

Kibana alerting enhancement

This bundle enhances the Kibana alerting experience. Storing all relevant information in indices and visualize the data in dashboards.

APM Services overview canvas

Average rating:

An adaptive turn key canvas example based on Elastic APM data.

Elastic Cloud Billing data collection and Kibana dashboard

Pulls Elastic Cloud Billing information from the Billing API then sends it to an Elasticsearch cluster and visualizes the results in Kibana dashboards.

Google Cloud monitoring dashboard

Dashboard to monitor GCP resources using different metrics and logs.