Squid Proxy Access Logs Dashboard
Visualize your Squid Proxy traffic with this dedicated Kibana dashboard.
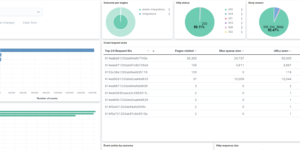
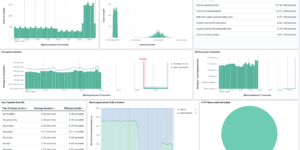
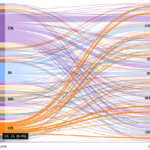
Tailored for data ingested via Filebeat’s Squid module, it offers insights into:
- Traffic Volume: Bytes sent/received over time.
- Top Domains: Most visited websites and domains.
- Response Codes: HTTP status code distribution (200, 403, 503, etc.).
- Client Activity: Top source IPs and user agents.
Contents: NDJSON file containing the dashboard and visualizations.
Source: molu8bits/squid-filebeat-kibana
| Tested versions | |
| ECS compliant |
You must log in to submit a review.