watcher logo

Monitoring for Large Shards

Description

This watch is getting data from the Elasticsearch shards API directly and checking for large shards.

It creates a helper index (large_shards), and it uses it to alert one time (per shard) based off the size of the shards defined in the metadata.

Find more information from the source repository:
Github Source Directory

Tested versions 7.x
ECS compliant

You must log in to submit a review.

Related downloads

Uptime watch using Heartbeat data

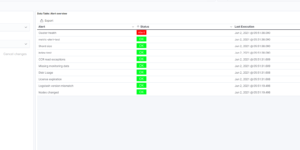
This watch checks the availability of your Heartbeat observed services. It will trigger an alert whenever at least one of your services is down.

Watch to detect large shards

This watch is getting data from the Elasticsearch shards API directly and checking for large shards.

Kibana alerting enhancement

This bundle enhances the Kibana alerting experience. Storing all relevant information in indices and visualize the data in dashboards.

Watcher job to integrate ChatGPT in Elasticsearch

Watcher job to integrate ChatGPT API from OpenAI in Elasticsearch. Helpful to find solutions for error messages very quick.

Watch for changes in IOWaits

A watch which alerts if the time spent by a hosts CPU in IOWait, has increased by more than than N% in the last Y mins.

These downloads could be also interesting for you

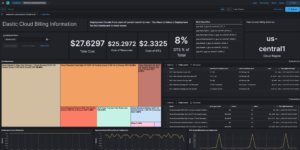
Elastic Cloud Billing data collection and Kibana dashboard

Pulls Elastic Cloud Billing information from the Billing API then sends it to an Elasticsearch cluster and visualizes the results in Kibana dashboards.

Google Cloud monitoring dashboard

Dashboard to monitor GCP resources using different metrics and logs.

Cloudflare Kibana dashboards

Cloudflare dashboards and ingest pipelines to visualize cloudflare logs

CMDB dependency in Kibana Dashboard

Kibana vega example to show how to load visualize relationships between different infrastructure and network components in vega.

APM Services overview canvas

Average rating:

An adaptive turn key canvas example based on Elastic APM data.