
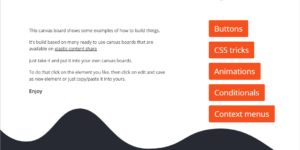
Kibana Canvas examples collection
A collection of canvas examples, like using conditionals, creating buttons, animations or context menues. Just copy paste into your Kibana Canvas project.
PI Hole Logstash Pipeline and Dashboard
A filter for Logstash parsing PI-Hole logs + Dashboard to visualize the data

Office display canvas example
Kibana canvas example showing an office screen with weather, news and stock information
Sigma Sysmon detection rules
A collection of rules based on the Sigma detection rules for Windows Sysmon events based on Winlogbeat data.

Kibana alerting enhancement
This bundle enhances the Kibana alerting experience. Storing all relevant information in indices and visualize the data in dashboards.
Sigma Windows inbuilt detection rules
A collection of rules based on the Sigma rules for Windows (inbuilt folder) based on Winlogbeat data .

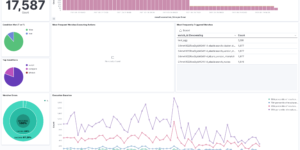
Detection engine alerts overview dashboard
Kibana Canvas dashboard that shows an aggregated view on the results of the detection engine in Elastic Security.
Sigma Windows Process Creation detection rules
A collection of rules based on the Sigma rules for Windows (process creation folder) based on Winlogbeat data .
Sigma detection rules for proxy server logs
A collection of rules based on the Sigma detection rules for proxy server and web server looks, e.g. zeek or suricata.
The search results are evaluated by ElasticPress using Elasticsearch clusters from Elastic Cloud.