TSVB Buttons

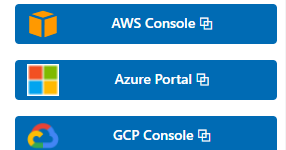
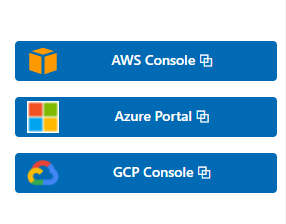
This visualization is an example of how to use buttons within Kibana dashboards. Its using custom CSS to style the buttons like normal Kibana buttons.

Its also using images and other elements for the links. The example is linking to AWS cloud portal, GCP portal and Azure portal. The links can easily be replaced by any link you like.

There are similar CSS styled elements used in our Kibana Observability dashboards.

If you like to link to different content based on the data that is shown in your dashboard its better to use drill downs.

Tested versions 7.x
ECS compliant No

You must log in to submit a review.

Related downloads

Sigma AWS Cloudtrail Detection rules

A collection of rules based on the Sigma rules for AWS based on the Filebeat AWS module and Elastic agent integration.

Watch to detect large shards

This watch is getting data from the Elasticsearch shards API directly and checking for large shards.

Detection engine alerts overview dashboard

Average rating:

Kibana Canvas dashboard that shows an aggregated view on the results of the detection engine in Elastic Security.

APM Services overview canvas

Average rating:

An adaptive turn key canvas example based on Elastic APM data.

Vega Scatterplot Kibana visualization

A scatterplot visualization made with Vega Lite for Kibana

AWS VPCFlow Kibana dashboard

Kibana dashboard for AWS VPCFlow log events

These downloads could be also interesting for you

Buttons for Kibana dashboards

Link to every content you want within your Kibana dashboards. This example is using links to cloud providers.

Playable Pacman

This is a playable version of pacman made with Vega.

Vega Compound Gauge

This is a compund gauge visualization made with Vega. Its very helpful for visualization of percentage values.

Elastic Cloud Billing data collection and Kibana dashboard

Pulls Elastic Cloud Billing information from the Billing API then sends it to an Elasticsearch cluster and visualizes the results in Kibana dashboards.

osquery performance dashboard

Kibana Dashboard example to visualize osquery performance

Google Cloud monitoring dashboard

Dashboard to monitor GCP resources using different metrics and logs.