
Kibana Download overview
Kibana downloads
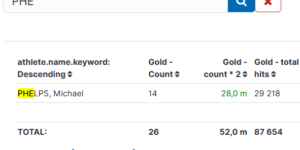
Kibana Enhanced Table plugin
Data Table visualization with enhanced features like computed columns, pivot table or filter bar
Sigma Sysmon detection rules
A collection of rules based on the Sigma detection rules for Windows Sysmon events based on Winlogbeat data.
Sigma Windows Process Creation detection rules
A collection of rules based on the Sigma rules for Windows (process creation folder) based on Winlogbeat data .
Sigma Windows inbuilt detection rules
A collection of rules based on the Sigma rules for Windows (inbuilt folder) based on Winlogbeat data .
Sigma AWS Cloudtrail Detection rules
A collection of rules based on the Sigma rules for AWS based on the Filebeat AWS module and Elastic agent integration.
Sigma Zeek Detection rules
A collection of rules based on the Sigma rules for Zeek based on the Filebeat Zeek module.

Observability Kibana Dashboard
A single pane of glass dashboard for Logs, Metrics, APM data and business KPIs.

Detection engine alerts overview dashboard
Kibana Canvas dashboard that shows an aggregated view on the results of the detection engine in Elastic Security.

More about Kibana
Download additional Kibana content and use it immediately within your Elastic deployment. Kibana content can be dashboards, canvas boards and any kind of visualization like pre build vega visualizations.
Kibana is a great tool to visualize any kind of data that is stored within Elasticsearch. Elastic delivers huge set of Kibana content within the Kibana apps. But users usually want to customize their dashboards and other views. Using Kibana this is possible for every kind of visualization.