
Kibana Download overview
Kibana downloads
PI Hole Logstash Pipeline and Dashboard
A filter for Logstash parsing PI-Hole logs + Dashboard to visualize the data
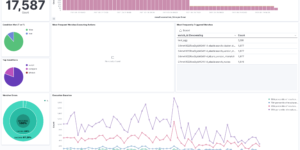

Filebeat Suricata Canvas dashboard
A Kibana Canvas dashboard example that visualizes suricata logs collected with Filebeat.

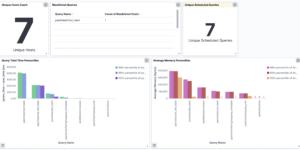
Filebeat Log analysis canvas example
This is a simple canvas dashboard example that analyzes logs created by Filebeat.

Office display canvas example
Kibana canvas example showing an office screen with weather, news and stock information
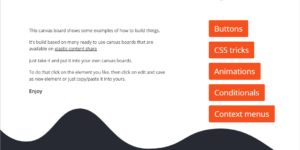
Kibana Canvas examples collection
A collection of canvas examples, like using conditionals, creating buttons, animations or context menues. Just copy paste into your Kibana Canvas project.
Sigma Elastic SIEM rules for web server logs
A collection of rules based on the Sigma detection rules for web server looks, e.g. apache, nginx or IIS.
Sigma detection rules for proxy server logs
A collection of rules based on the Sigma detection rules for proxy server and web server looks, e.g. zeek or suricata.
More about Kibana
Download additional Kibana content and use it immediately within your Elastic deployment. Kibana content can be dashboards, canvas boards and any kind of visualization like pre build vega visualizations.
Kibana is a great tool to visualize any kind of data that is stored within Elasticsearch. Elastic delivers huge set of Kibana content within the Kibana apps. But users usually want to customize their dashboards and other views. Using Kibana this is possible for every kind of visualization.