Description
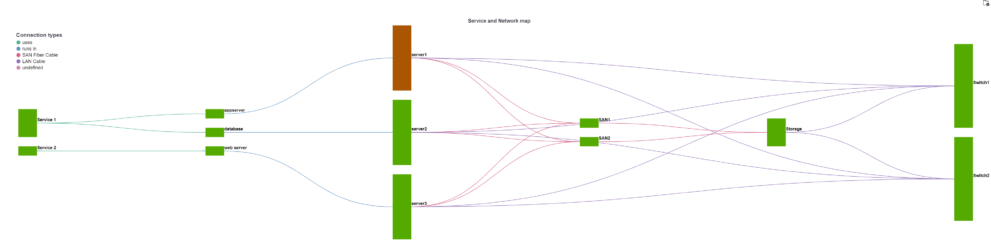
This Kibana download includes a dashboard and customized Vega visualization. The target is to visualize hierarchical relationships between different components within IT networks. This relations are typically build within a so called Configuration Management Database (CMDB) like ServiceNow CMDB. Using this Vega visualization as a template for CMDB data is a great way to extend the relations with health information from other monitoring data sources.
This Kibana Vega example is using a simplified data structure that only contains the name, group, relation, relation type and process it belongs to (Example dataset is part of the download). In addition to that the different parts / components in the visualization can get enriched with condition information like missed CPU thresholds. The example is working with an status index that just contains the name and the current alert status.
What is CMDB?
A CMDB (Configuration Management Database) serves as the central database for IT service management, or ITSM. It is a repository that acts as a data warehouse and stores information about the IT environment of companies. It represents the foundation for high-quality IT customer service. It also forms the basis for stable systems and applications.
Advantages of using a CMDB
- Complete record of your IT environment in one place with easy access
- Integration of data from external data sources (e.g. suppliers) possible
- Cost savings due to improved utilization of hardware and software assets
- Understanding the composition of critical assets and their components
- Understanding of the function, users and use of assets in various business processes
- Information to support decision-making about the IT environment, operational costs and technology decisions
- Risk management by providing an inventory of assets that may have vulnerabilities
- Configuration management projects offer a high level of transparency in the management of IT assets, from which IT administrators benefit significantly
- Easily track changes in IT infrastructure thanks to configuration management software
In combination with the Observability approach of Elastic this leads to a must have tool within your IT infrastructure. Collect the dependency’s and other CMDB related information in your favorite CMDB tool and visualize it in combination with Security and Availability information in Elastic as part of your Observability strategy.
| Tested versions | 7.x, 8.x |
| ECS compliant | No |
You must log in to submit a review.