Description
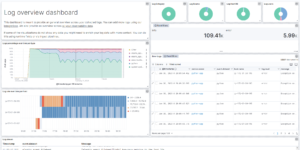
This download enhances the Kibana alerting experience. Kibana alerting is an easy to use evolution of the alerting capabilities within the Elastic Stack. All relevant configuations can be easily managed through the Kibana Frontend. However to get an overview about the existing alerts and the status the user have to visit stack management. That makes it hard to get the status and history of alerts into dashboards.
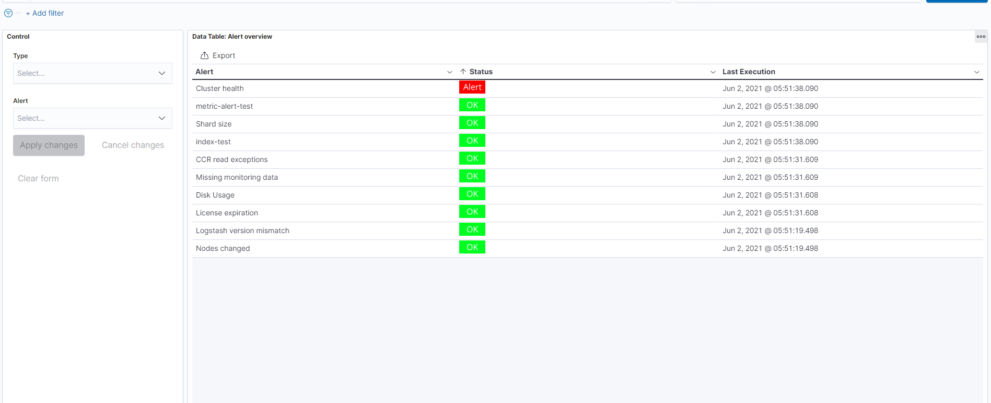
This enhancement is loading the current state of each Kibana alert into a separate index using a watcher script. A second watcher script is saving the current state of each alert into another index to preserve the history of each alert. The download also includes two dashboards. The Alert overview dashboard is showing each Kibana alert and the current status. A Kibana alert could be configured manually, automatically by using Stack Monitoring or the use of Elastic Security Detection rules. The overview dashboard is configured to offer a drilldown into the Alert history dashboard called Alert overview. To trigger the drill down you need to filter on the alert you would like to observe more in depth.
What is Kibana alerting?
Kibana alerting allows you to define rules to detect complex conditions within different Kibana apps and trigger actions when those conditions are met. Alerting is integrated with Observability, Security, Maps and Machine Learning, can be centrally managed from the Management UI, and provides a set of built-in connectors and rules (known as stack rules) for you to use.
Combining the visibility in all those kind of alerts into one single dashboard that can get extended with every other kind of information is extremly valuable for every use case.
| Tested versions | 7.1, 7.9, 7.10, 7.11, 7.12, 7.13 |
| ECS compliant | No |
You must log in to submit a review.