Description
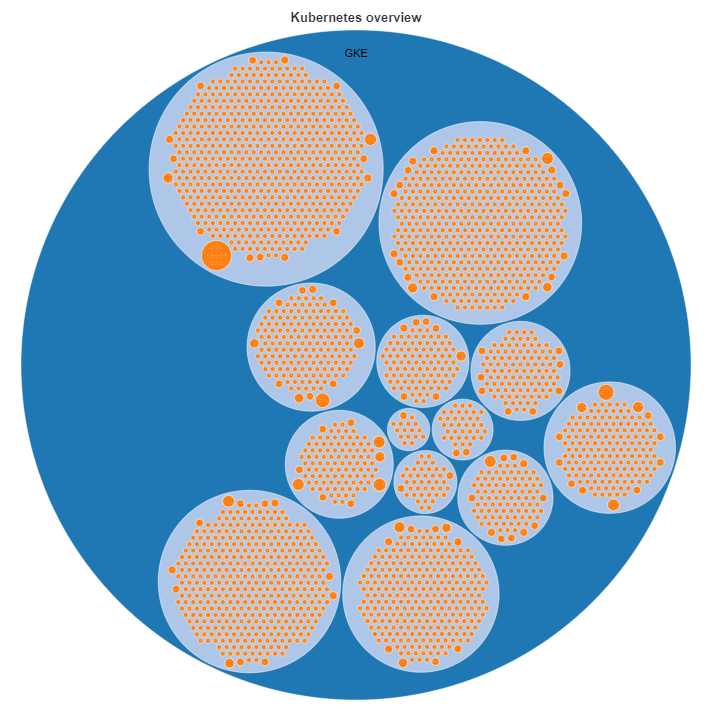
This Kibana VEGA visualization is used to visualize the architecture of any given Kubernetes ( aka k8s ) architecture. By default it takes the ECS formatted Kubernetes monitoring data collected by Elastic Agent and displays the relationship between the different components.
The Kibana Kubernetes architecture overview takes the following fields to show the hierarchy:
- Kubernetes Node
- Kubernetes Pod
- Kubernetes Container
The three different layers are placed within the environment. This is used as the root node of the Kubernetes hierarchy. The name of the root node can get changed. The version that you can download here is not using any specific metric for the size for each element. However the Vega visualization is prepared to take any kind of metric, like CPU or Memory consumption and size every Kubernetes element accordingly.
Kubernetes and Container monitoring
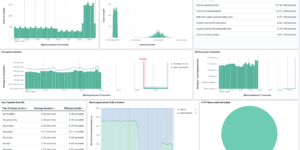
Monitoring Kubernetes and other Container related environments is a very common use case to use Elastic for. The simplicity of collecting all relevant Metrics and Logs by using the Elastic Agent and Kubernetes integrations makes it very easy to start and succeed. Elastic also offers a couple of very useful and comprehensive OOTB dashboards for Kubernetes environments.
The reason why customers need to monitore and observe their container environments and orchestration is the increased complexity of what happens inside the orchestration. Kubernetes is able to start, stop, scale and recover containers at any given time. Containers can have a very short live time so that traditional monitoring tools are not able to provide the full view.
How Kibana and Elastic can help
Using Kibana and Vega visualizations in order to monitor Kubernetes architectures helps to keep the overview of what is happening. Any visualization is able to get filtered to the area of interest within ms. Elastic can store any amount of data and is able to search and filter for root causes of specific problems within very short time.
| Tested versions | 7.x, 8.x |
| ECS compliant | Yes |
You must log in to submit a review.