canvas_office

Description

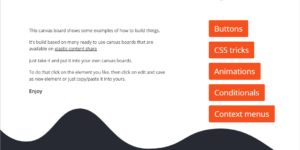
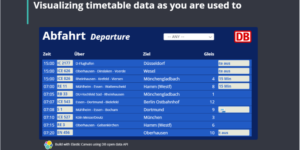
This Kibana Canvas examples shows how to load live data into Elastic in near real time and show them using Kibana Canvas dashboards.

Please note that there are image assets in this workpad that are not cannot be used for redistribution. This Canvas workpad is solely meant to be an example to learn from

Data set

canvas_office.py creates documents that contain news articles, the weather and stock information. I run a cron job on a raspberry pi to run this python script regularly every 15 minutes. API keys from Open Weather Map (https://openweathermap.org/api) and News API (https://newsapi.org/) are required and if you plan to use this, some customization may be required for your local news articles and weather.

Drag and drop the Canvas workpad canvs_office.json into the Canvas app. This is currently configured to cycle through each page in full screen mode every 5 seconds to show off the workpad, but can be adjusted to something more realistic like 1 minute.

Source

This example was originally posted here: https://github.com/alexfrancoeur

Tested versions 7.12
ECS compliant

You must log in to submit a review.

Related downloads

PI Hole Logstash Pipeline and Dashboard

A filter for Logstash parsing PI-Hole logs + Dashboard to visualize the data

APM Services overview canvas

Average rating:

An adaptive turn key canvas example based on Elastic APM data.

Coffee Canvas Example

Kibana Canvas example infographic to show coffee consumption on a wallboard

Elastic Stack Monitoring Dashboard

Kibana dashboards that is showing the monitoring data collected by Elastics in built monitoring capabilities.

Kubernetes architecture overview

Vega visualization to show the dependencies between the different Kubernetes components in a single visualization

Vega Compound Gauge

This is a compund gauge visualization made with Vega. Its very helpful for visualization of percentage values.

These downloads could be also interesting for you

Watcher History Dashboard

This dashboard shows the history of executed watcher jobs.

Ask Me Anything Booth – Canvas Example

This is an example canvas page that shows how to visualize using canvas in general.

Vega advanced heat map

Vega example to show GitHub commits per author per hour of day.

AWS Cloudtrail Monitoring dashboard

Deep insights into AWS Cloudtrail events for SIEM and Monitoring

Vega Compound Gauge

This is a compund gauge visualization made with Vega. Its very helpful for visualization of percentage values.

Vega Clock UTC

This is a working clock visualization in UTC time.