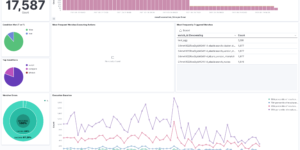
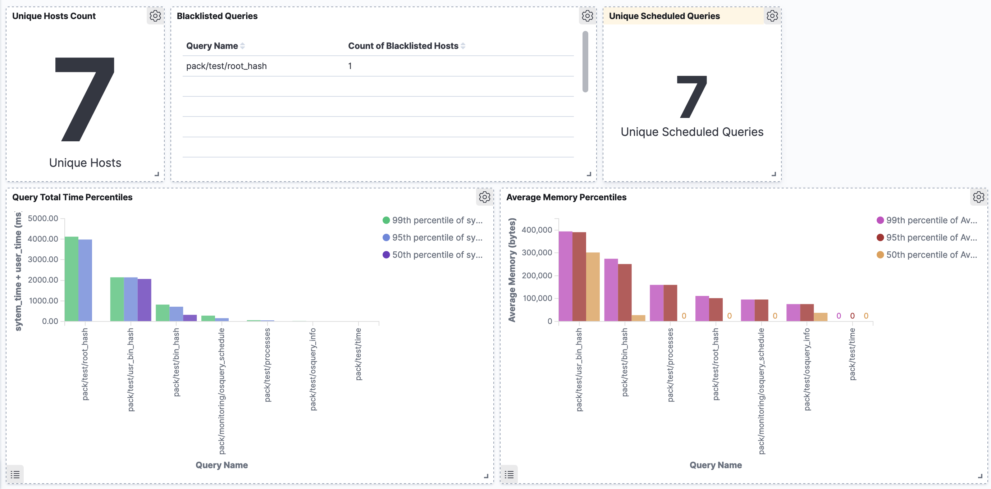
osquery kibana dashboard

Description

This is an Kibana dashboard example visualizing performance metrics of osquery. The example has been created as part of this blog article. In order to get the right data for the dashboard you need to follow the guide in that article.

The recommended way to get osquery data into Elasticsearch is using the Filebeat module

What is osquery?

osquery is a SQL powered operating system instrumentation, monitoring, and analytics framework.

osquery exposes the operating system as a high-performance relational database. This allows you to write SQL-based queries to browse operating system data. With osquery, SQL tables represent abstract concepts such as running processes, loaded kernel modules, open network connections, browser plug-ins, hardware events, or file hashing. SQL tables are implemented through simple plug-ins and extension APIs. Various tables already exist, and more are being written: https://osquery.io/schema.

Source

Originally found at https://medium.com/fleetdm/build-an-osquery-performance-dashboard-1b1762ee3880

Tested versions 7.13
ECS compliant No

You must log in to submit a review.

Related downloads

Elastic Cloud Billing data collection and Kibana dashboard

Pulls Elastic Cloud Billing information from the Billing API then sends it to an Elasticsearch cluster and visualizes the results in Kibana dashboards.

Threat detection Kibana dashboard

Kibana dashboard example visualizing the results of the Elastic SIEM detection engine

Ingest Pipeline Monitoring

This Kibana dashboard can be used monitor your ingest pipelines

RUM extension dashboard

This dashboard provide deeper insight into the real user monitoring data collected by Elastic RUM.

Azure billing data network

A vega visualization that shows the connection between resource group, resource type and the resource itself based on Elastic agent azure billing data integration.

Office display canvas example

Kibana canvas example showing an office screen with weather, news and stock information

These downloads could be also interesting for you

Detection engine alerts overview dashboard

Average rating:

Kibana Canvas dashboard that shows an aggregated view on the results of the detection engine in Elastic Security.

Threat detection Kibana dashboard

Kibana dashboard example visualizing the results of the Elastic SIEM detection engine

Office display canvas example

Kibana canvas example showing an office screen with weather, news and stock information

Elastic Stack Monitoring Dashboard

Kibana dashboards that is showing the monitoring data collected by Elastics in built monitoring capabilities.

Ingest Pipeline Monitoring

This Kibana dashboard can be used monitor your ingest pipelines

Cloudflare Kibana dashboards

Cloudflare dashboards and ingest pipelines to visualize cloudflare logs