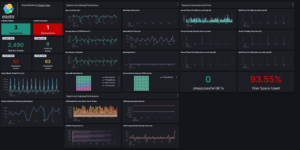
Elastic Stack Monitoring Dashboard
Kibana dashboards that is showing the monitoring data collected by Elastics in built monitoring capabilities.
Kubernetes architecture overview
Vega visualization to show the dependencies between the different Kubernetes components in a single visualization
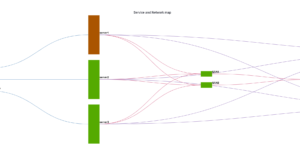
CMDB dependency in Kibana Dashboard
Kibana vega example to show how to load visualize relationships between different infrastructure and network components in vega.
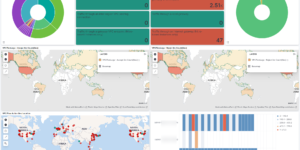
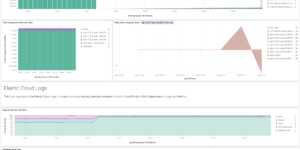
Elastic Cloud Monitoring dashboard
Kibana dashboard that uses the Elastic Cloud monitoring data to provide better insights into what’s happening in your cloud environment.
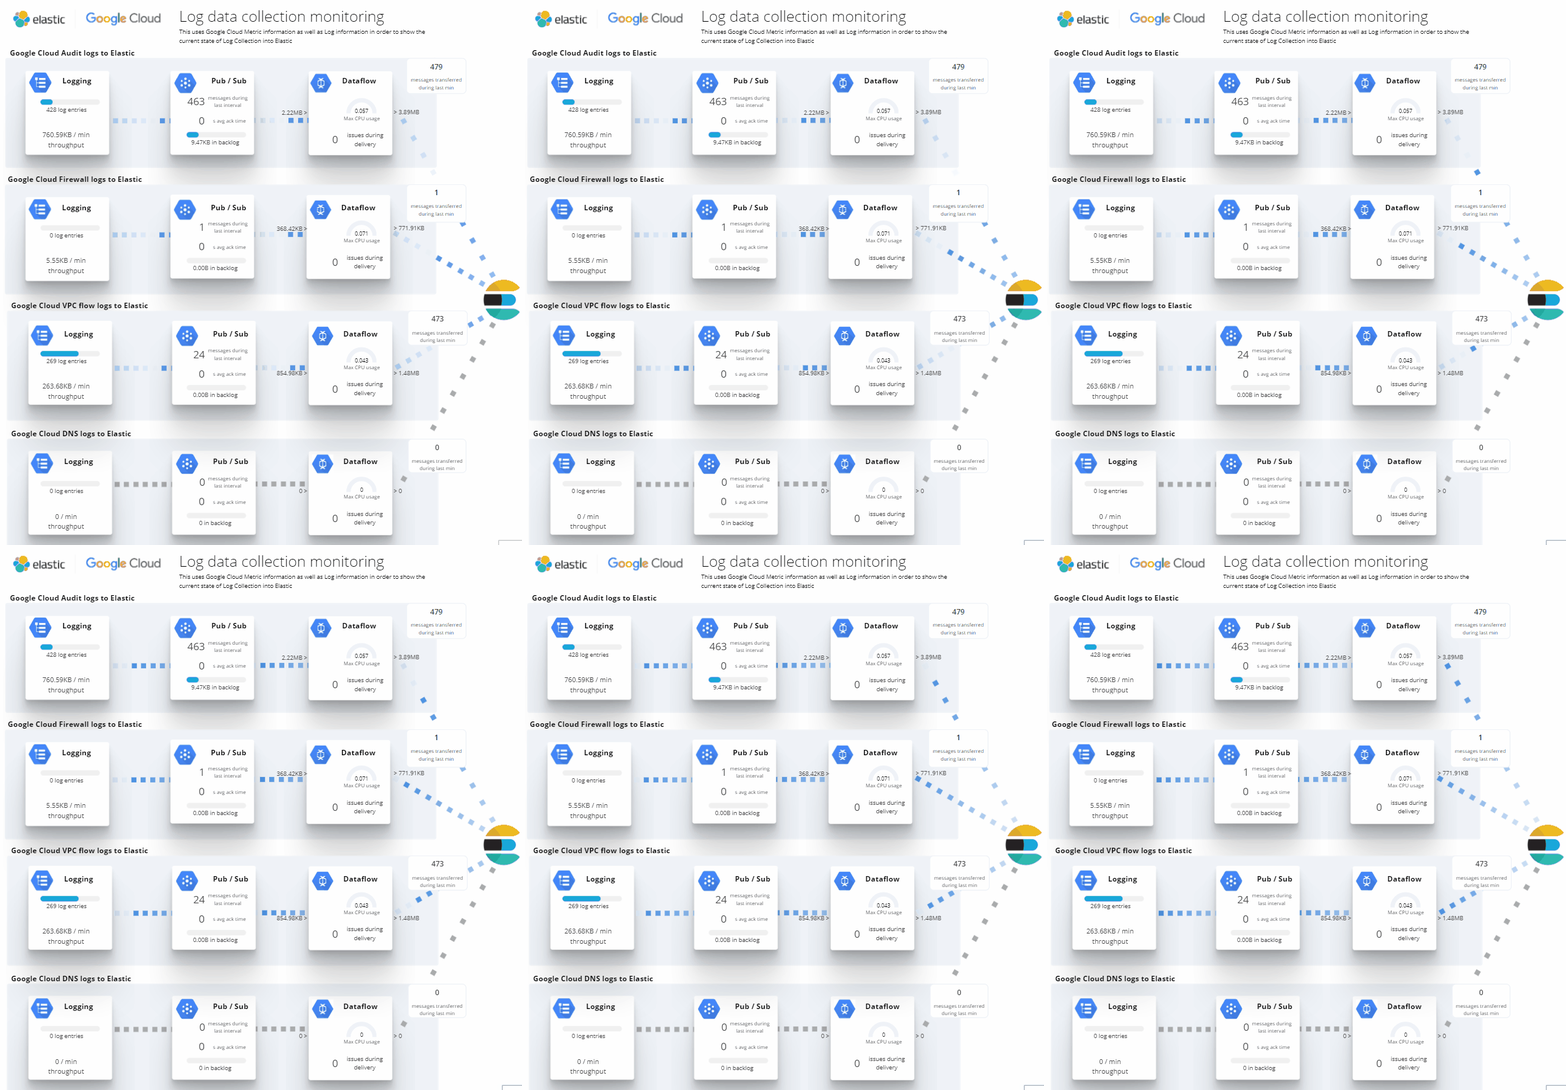
Google Cloud Log Ingestion dashboard
Canvas Board to analyze the log data collection of Google Cloud via Dataflow using the Google Cloud Metric module data
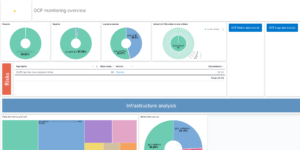
Google Cloud monitoring dashboard
Dashboard to monitor GCP resources using different metrics and logs.
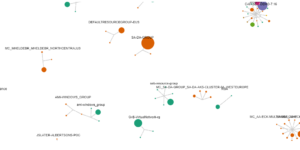
Azure billing data network
A vega visualization that shows the connection between resource group, resource type and the resource itself based on Elastic agent azure billing data integration.
Buttons for Kibana dashboards
Link to every content you want within your Kibana dashboards. This example is using links to cloud providers.

