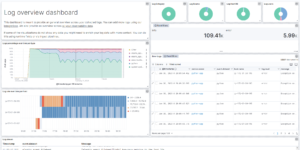
Spring Boot & Micrometer Dashboard

A ready-to-use Kibana dashboard for monitoring Spring Boot applications via Micrometer.
This package includes the necessary index patterns, visualizations, and dashboards to track:

  • JVM Metrics: Memory usage, GC pauses, threads.
  • HTTP Requests: Throughput, latency, error rates.
  • System Metrics: CPU usage, file descriptors.

Contents: NDJSON files for Index Patterns, Visualizations, and the Dashboard itself.

Source: acroquest/micrometer-kibana-dashboard

Tested versions
ECS compliant

You must log in to submit a review.

Related downloads

Vega Clock UTC

This is a working clock visualization in UTC time.

Elastic Cloud Billing data collection and Kibana dashboard

Pulls Elastic Cloud Billing information from the Billing API then sends it to an Elasticsearch cluster and visualizes the results in Kibana dashboards.

Traffic light using Vega

This traffic light visualizations is build with vega. The thresholds can be defined via values within the document itself.

Data flow canvas

Average rating:

This canvas examples shows some possibilities of how to visualize data flows. Every flow can be activated / deactivated based on your Elasticsearch data.

Crawler dashboard

A Kibana dashboard that visualizes the result of the crawler from Elastic Enterprise Search

osquery performance dashboard

Kibana Dashboard example to visualize osquery performance

These downloads could be also interesting for you

Cloudflare Kibana dashboards

Cloudflare dashboards and ingest pipelines to visualize cloudflare logs

Move to next ILM phase Watcher

This watcher job is moving specific indices based on e.g. disc usage into the next ILM phase.

Elastic Cloud Billing data collection and Kibana dashboard

Pulls Elastic Cloud Billing information from the Billing API then sends it to an Elasticsearch cluster and visualizes the results in Kibana dashboards.

Sigma Elastic SIEM rules for web server logs

A collection of rules based on the Sigma detection rules for web server looks, e.g. apache, nginx or IIS.

Threat detection Kibana dashboard

Kibana dashboard example visualizing the results of the Elastic SIEM detection engine

Spring Boot Micrometer Dashboard

Monitor Spring Boot applications using Micrometer metrics.