Description

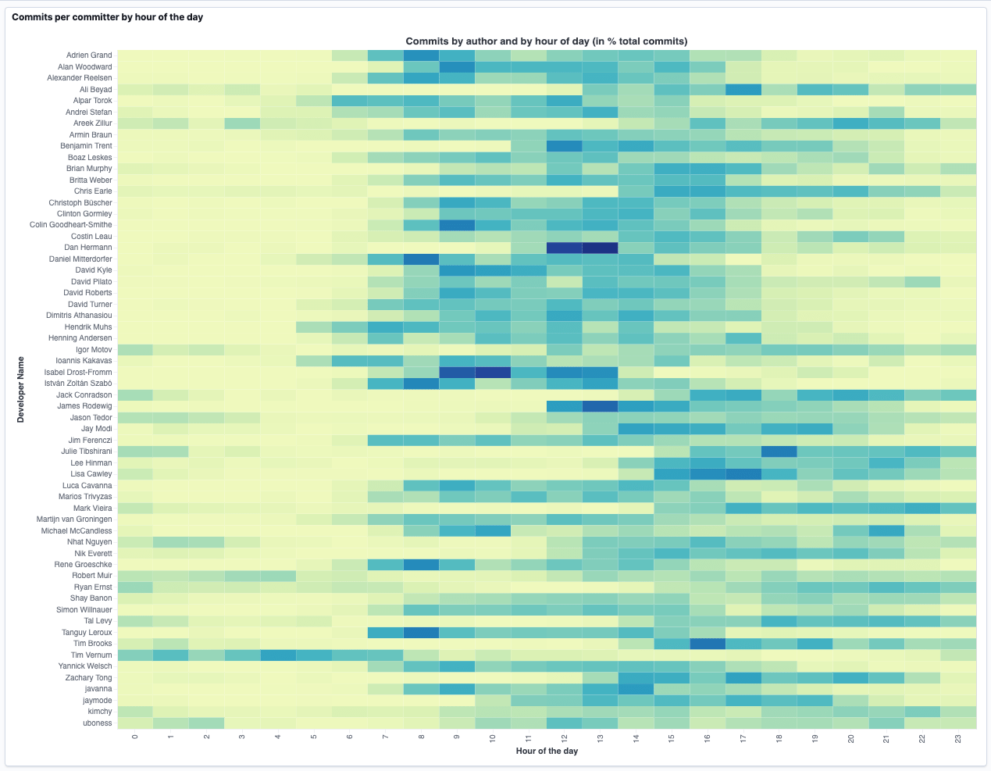
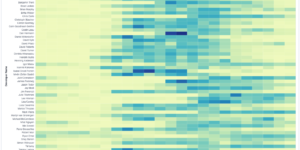
This example visualizes GitHub commit data in an Hour Of Day Vega visualization. This works great to see how different entities contributed to the overall amount of matches. So this can be easily adapted for showing the access of specific sites in comparison to each other.

Source

This visualization was originally found at https://spinscale.de/posts/2021-06-23-using-kibana-vega-for-awesome-visualizations.html

Tested versions 7.13
ECS compliant No

You must log in to submit a review.

Related downloads

Filebeat Log analysis canvas example

This is a simple canvas dashboard example that analyzes logs created by Filebeat.

Vega Compound Gauge

This is a compund gauge visualization made with Vega. Its very helpful for visualization of percentage values.

Ask Me Anything Booth – Canvas Example

This is an example canvas page that shows how to visualize using canvas in general.

Kibana Enhanced Table plugin

Data Table visualization with enhanced features like computed columns, pivot table or filter bar

Resource Optimization Dashboard

Elastic Resource Optimization Dashboard to seamlessly integrate APM insights with cloud cost data for actionable resource management and cost-saving strategies

These downloads could be also interesting for you

Kibana Canvas examples collection

Average rating:

A collection of canvas examples, like using conditionals, creating buttons, animations or context menues. Just copy paste into your Kibana Canvas project.

Resource Optimization Dashboard

Elastic Resource Optimization Dashboard to seamlessly integrate APM insights with cloud cost data for actionable resource management and cost-saving strategies

PI Hole Logstash Pipeline and Dashboard

A filter for Logstash parsing PI-Hole logs + Dashboard to visualize the data

Kibana Maps with Open Weather Map

This is the default basemap of Kibana incl. the Open Weather Map tile for temperature, wind and pressure

Vega Compound Gauge

This is a compund gauge visualization made with Vega. Its very helpful for visualization of percentage values.

Sankey visualization example

This is an example of how to build an sankey visualization using the vega visualization in Kibana.