Description

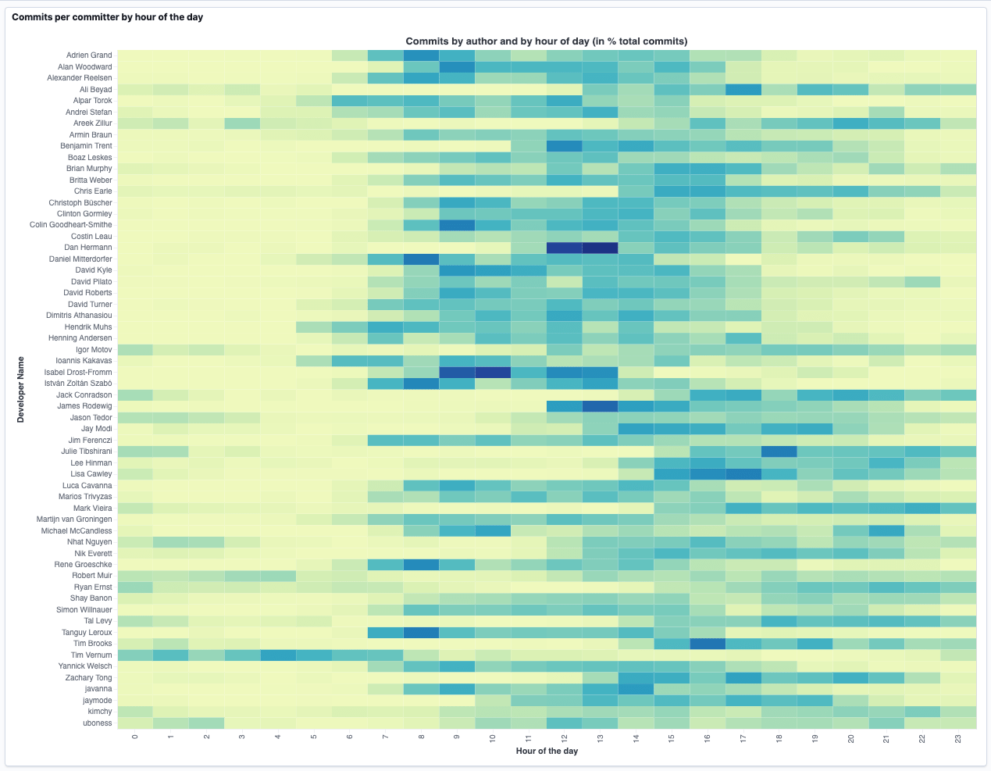
This example visualizes GitHub commit data in an Hour Of Day Vega visualization. This works great to see how different entities contributed to the overall amount of matches. So this can be easily adapted for showing the access of specific sites in comparison to each other.

Source

This visualization was originally found at https://spinscale.de/posts/2021-06-23-using-kibana-vega-for-awesome-visualizations.html

Tested versions 7.13
ECS compliant No

You must log in to submit a review.

Related downloads

Azure billing data network

A vega visualization that shows the connection between resource group, resource type and the resource itself based on Elastic agent azure billing data integration.

Elastic Stack Monitoring Dashboard

Kibana dashboards that is showing the monitoring data collected by Elastics in built monitoring capabilities.

Kubernetes architecture overview

Vega visualization to show the dependencies between the different Kubernetes components in a single visualization

Filebeat Suricata Canvas dashboard

A Kibana Canvas dashboard example that visualizes suricata logs collected with Filebeat.

Vega Scatterplot Kibana visualization

A scatterplot visualization made with Vega Lite for Kibana

Vega Clock UTC

This is a working clock visualization in UTC time.

These downloads could be also interesting for you

RUM extension dashboard

This dashboard provide deeper insight into the real user monitoring data collected by Elastic RUM.

Traffic light using Vega

This traffic light visualizations is build with vega. The thresholds can be defined via values within the document itself.

Elastic Cloud Monitoring dashboard

Kibana dashboard that uses the Elastic Cloud monitoring data to provide better insights into what’s happening in your cloud environment.

Data flow canvas

Average rating:

This canvas examples shows some possibilities of how to visualize data flows. Every flow can be activated / deactivated based on your Elasticsearch data.

Resource Optimization Dashboard

Elastic Resource Optimization Dashboard to seamlessly integrate APM insights with cloud cost data for actionable resource management and cost-saving strategies