Elastic Watcher Dashboard

Description

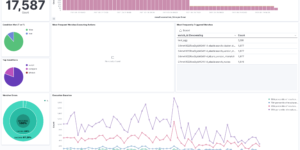
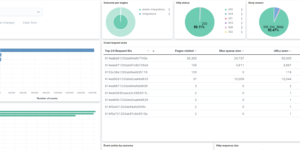
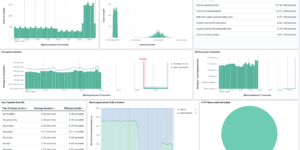
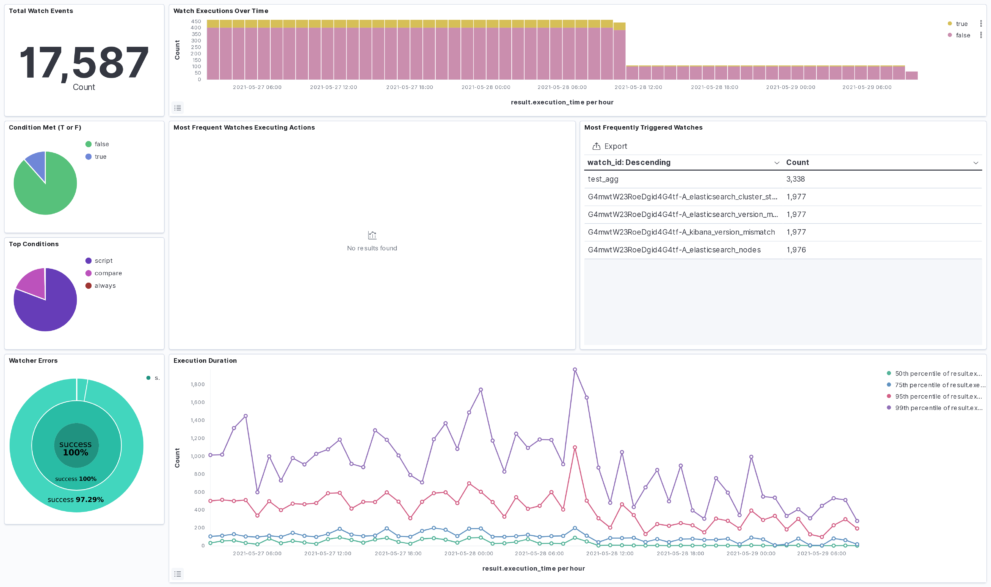
The Watcher History Dashboard shows the history of all the watcher jobs that are configured in your Elasticsearch deployment. This works by taking data from the system watcher history index that is created automatically when you are using watchers.

This is an Kibana example dashboard that can be easily extended based on your own needs. Also have a look into our Watcher job library if you need more information regardings watchers and what you can do with it.

Tested versions 7.12
ECS compliant

You must log in to submit a review.

Related downloads

Filebeat Suricata Canvas dashboard

A Kibana Canvas dashboard example that visualizes suricata logs collected with Filebeat.

Elastic Cloud Billing data collection and Kibana dashboard

Pulls Elastic Cloud Billing information from the Billing API then sends it to an Elasticsearch cluster and visualizes the results in Kibana dashboards.

Crawler dashboard

A Kibana dashboard that visualizes the result of the crawler from Elastic Enterprise Search

Elasticsearch Performance Troubleshooting Kit

Download the Elasticsearch Performance Troubleshooting Kit to efficiently diagnose and resolve slow query issues in your Elasticsearch environment.

PI Hole Logstash Pipeline and Dashboard

A filter for Logstash parsing PI-Hole logs + Dashboard to visualize the data

osquery performance dashboard

Kibana Dashboard example to visualize osquery performance

These downloads could be also interesting for you

Filebeat Log analysis canvas example

This is a simple canvas dashboard example that analyzes logs created by Filebeat.

AWS VPCFlow Kibana dashboard

Kibana dashboard for AWS VPCFlow log events

Crawler dashboard

A Kibana dashboard that visualizes the result of the crawler from Elastic Enterprise Search

Elastic Stack Monitoring Dashboard

Kibana dashboards that is showing the monitoring data collected by Elastics in built monitoring capabilities.

Observability Kibana Dashboard

A single pane of glass dashboard for Logs, Metrics, APM data and business KPIs.

AWS Cloudtrail Monitoring dashboard

Deep insights into AWS Cloudtrail events for SIEM and Monitoring