How to use the elastic content share?
You are looking for prebuilt content to use it in your Elastic environment like Kibana dashboards, Watcher alerting rules or extensions to your observability solution? If you are a user of the Elastic SIEM as part of your Elastic Security solution you can also extend the OOTB detection engines rules. Download prebuild Kibana dashboards now instead of creating it on your own!
The elastic-content-share offers a wide variety of Elastic based content from Elastic users for Elastic users. Feel free to look around in our Download area what others has created for you. If you are content creator we would be more than happy if you would share your stuff here for the rest of world.
Deploy in seconds

The downloads you can find here can be deployed within seconds into your Elastic Cloud deployment.
Share your content

If you made a dashboard that you are proud of just share it with the Elastic community.
Learn Elastic

Use our examples and video database to learn more about how to use Elastic in your environment successfully.
Start downloading ELK Stack content now
Downloading and using Elastic content is easy. For any part of the ELK stack you are able to download relevant content here. You can have a look into specific categories or just looking at all our downloads at once.
Top contributions
Sigma detection rules for proxy server logs
A collection of rules based on the Sigma detection rules for proxy server and web server looks, e.g. zeek or suricata.
Kubernetes architecture overview
Vega visualization to show the dependencies between the different Kubernetes components in a single visualization
Impossible travel transform job
Impossible travel detection by calculating the distance between two login locations in combination with the time between the two logins
OpenSIEM Logstash Parsing
Logstash Parsing Configurations for Elastic SIEM parses many different sources into ECS
Extensions for every part of your ELK stack
Latest contributions
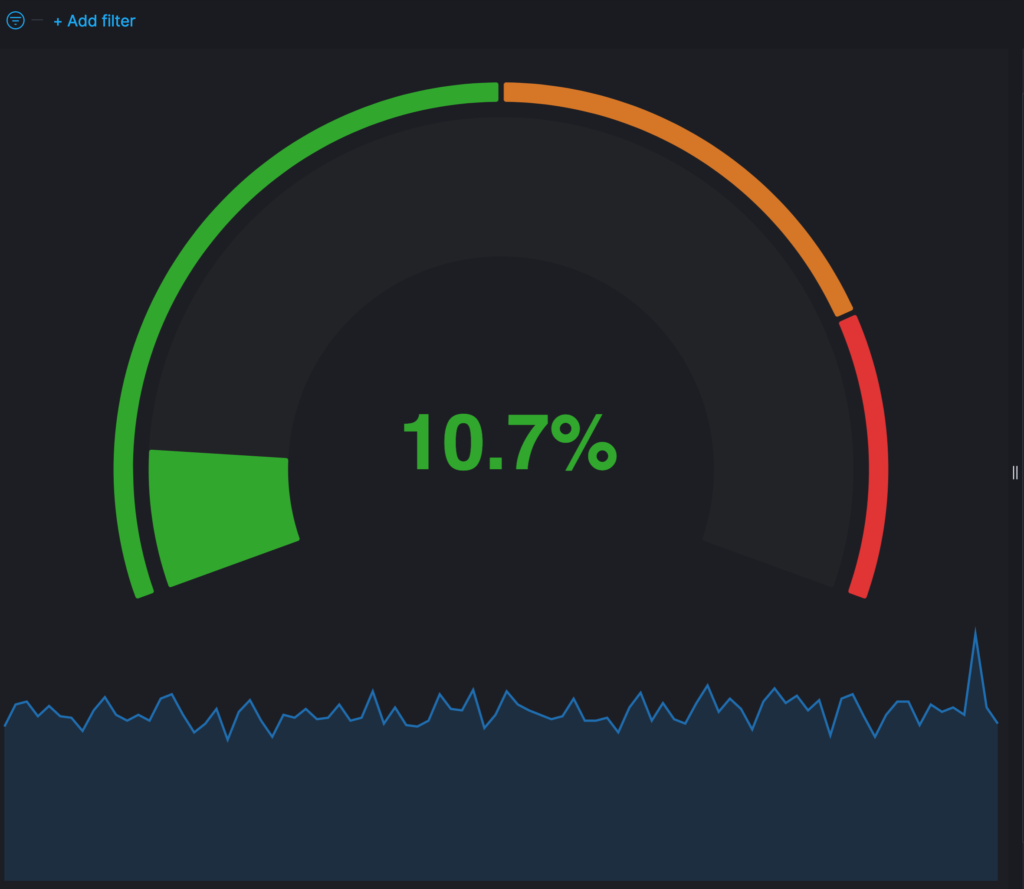
Vega Compound Gauge
This is a compund gauge visualization made with Vega. Its very helpful for visualization of percentage values.
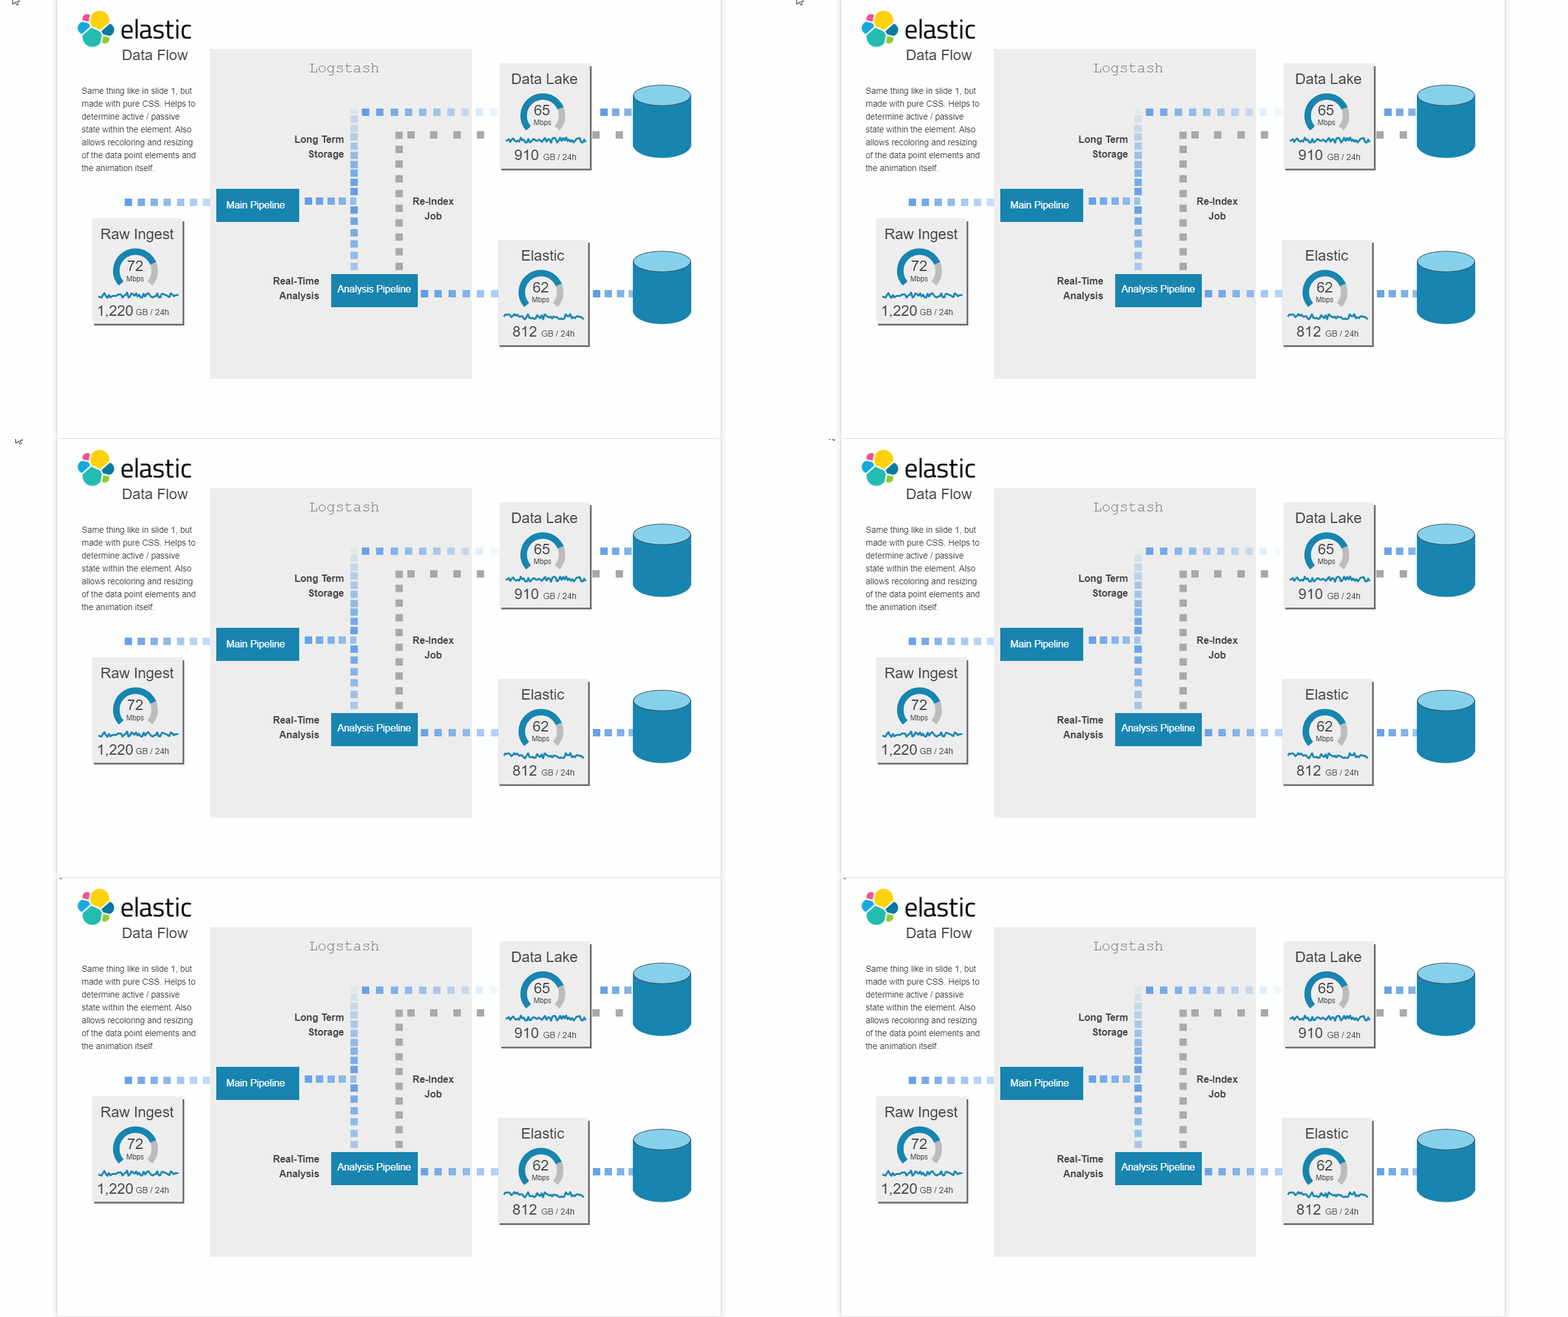
Data flow canvas
This canvas examples shows some possibilities of how to visualize data flows. Every flow can be activated / deactivated based on your Elasticsearch data.
Timetable canvas
This canvas examples shows timetable data from trains. Its build based on the real world information panel in german trian stations. Its refreshing based on current time.
Traffic light using Vega
This traffic light visualizations is build with vega. The thresholds can be defined via values within the document itself.
Ask Me Anything Booth – Canvas Example
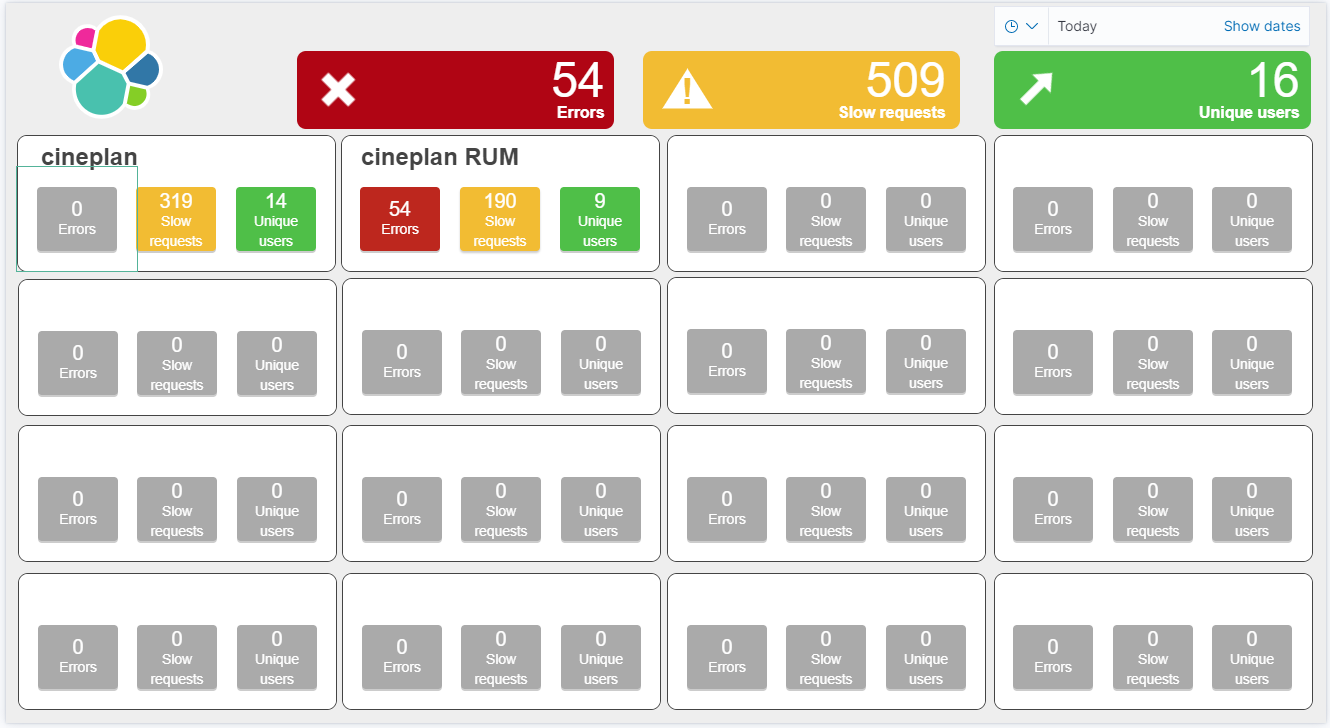
This is an example canvas page that shows how to visualize using canvas in general.
Watch to move older Elasticsearch indices into freezed state
This watch is moving time based indices into the frozen state.
Watch to detect large shards
This watch is getting data from the Elasticsearch shards API directly and checking for large shards.
Watch for changes in IOWaits
A watch which alerts if the time spent by a hosts CPU in IOWait, has increased by more than than N% in the last Y mins.
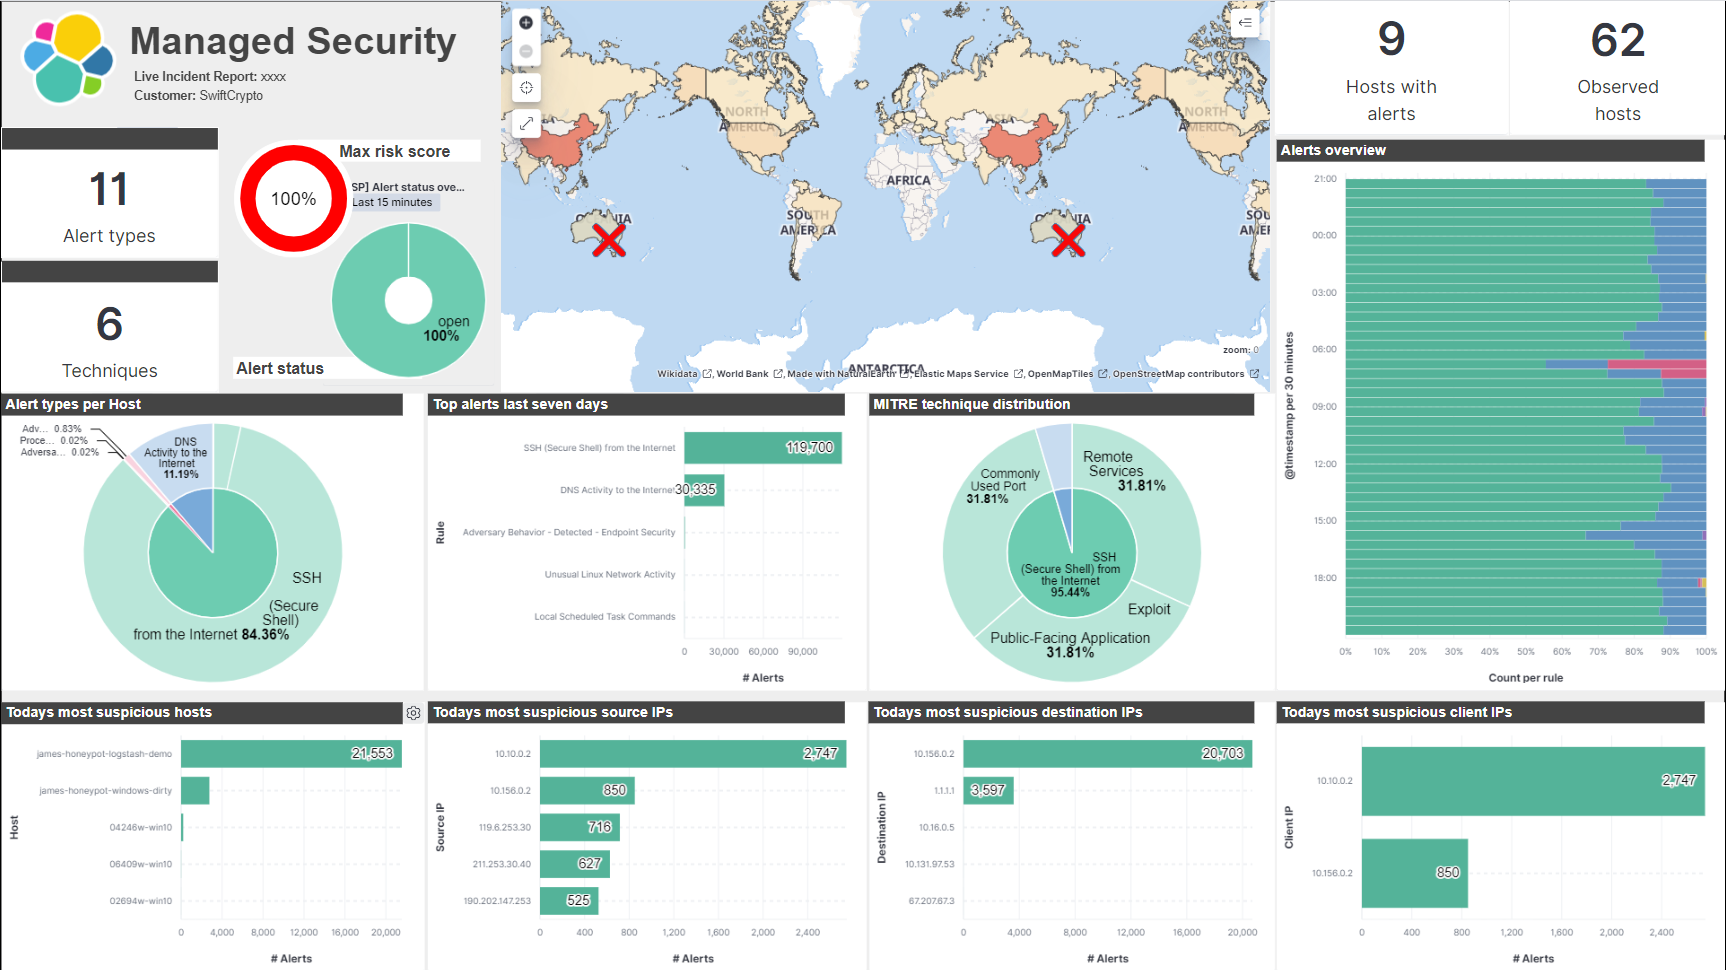
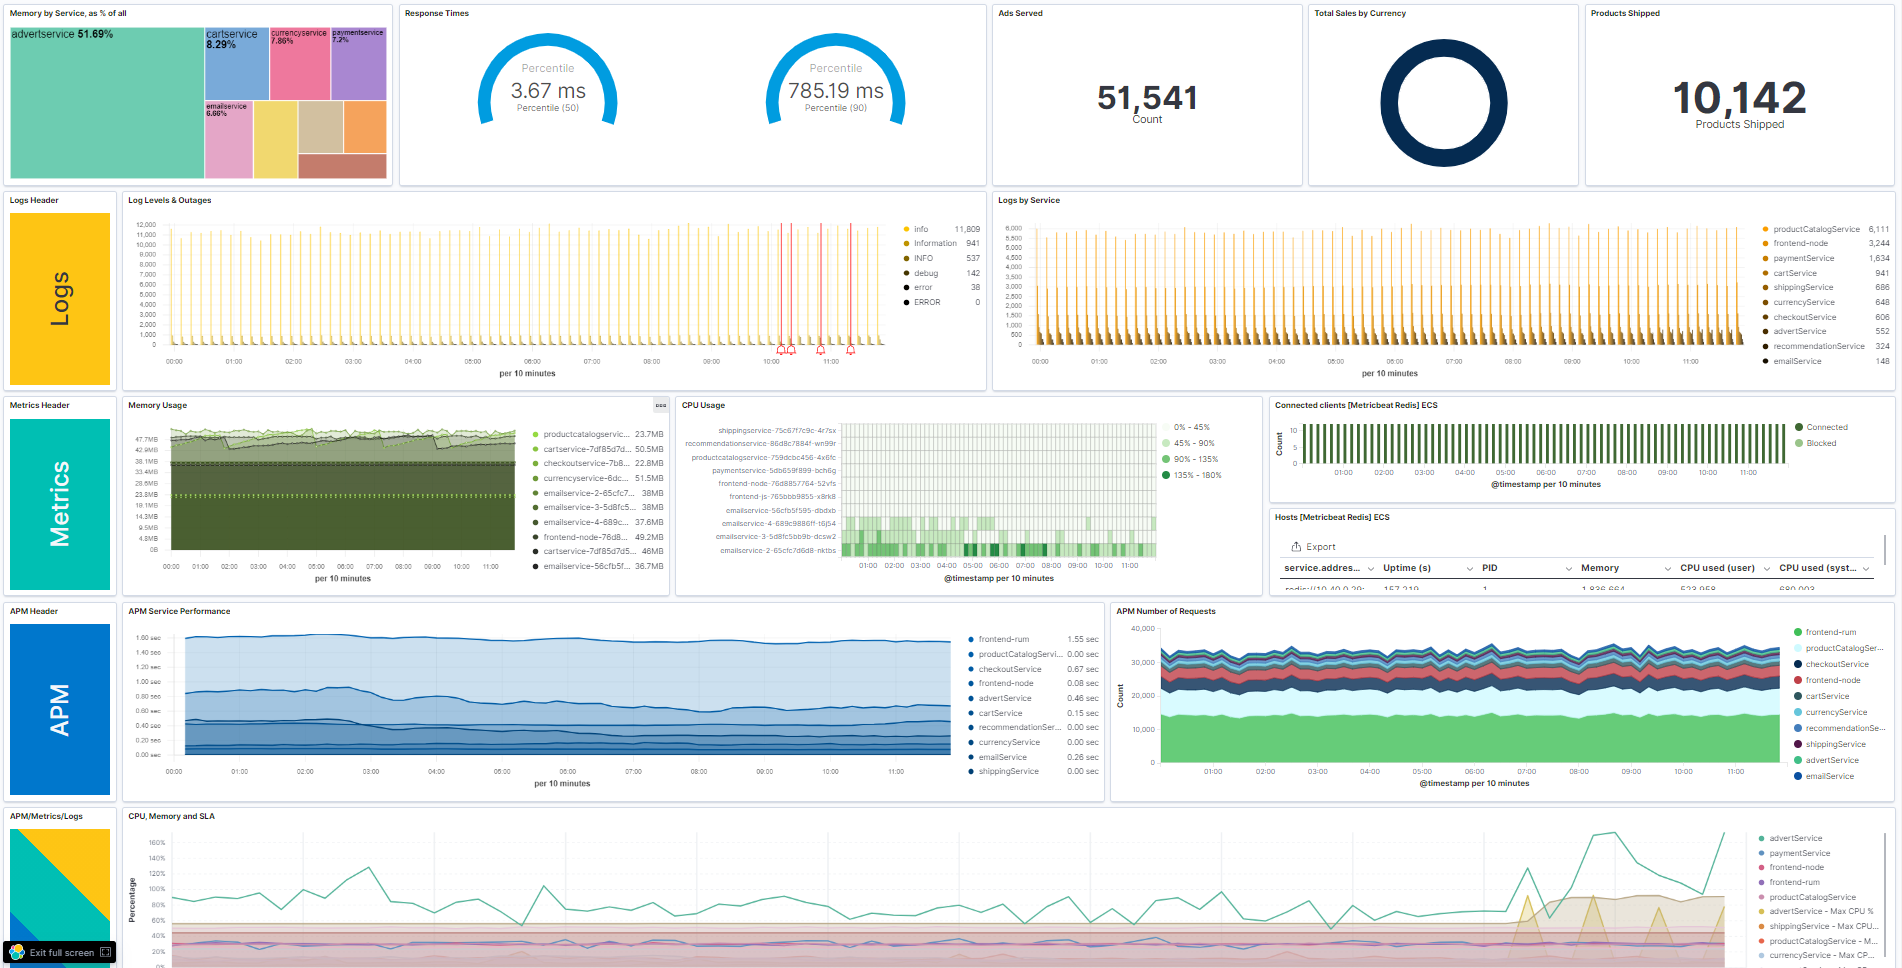
Download prebuilt Kibana dashboards is a great way to quickly start using Elastic in production. Kibana comes with a lot of prebuilt dashboards and templates. But its always good to see what others are using.
The Elastic Content Share provides content for Kibana like Dashboards, Visualizations and Canvas Boards. We also provide content for Elasticsearch like Watcher rules and specific mappings. Another important part is Logstash. For Logstash we provide prebuilt pipelines for different data sources. Elastic offers three different solutions based on the ELK stack, its Elastic Enterprise Search, Elastic Observability and Elastic Security. While this is great the users of Elastic Stack can do much more with it. In our blog articles you find many examples of how you could leverage the power of the Elastic Stack for your needs.
FAQ about download prebuilt Kibana dashboards
The Elastic Content Share is a platform to share content like Monitoring Dashboards for all the products offered by Elastic. These products are Kibana, Elasticsearch, Logstash and Beats. We also offer our help for any Elastic specific request you have.
No, the Elastic Content Share is a project from the community. It is not officially released nor maintained by elastic.
You will find official elastic offerings at elastic.co
Kibana is an open source data visualization dashboard for Elasticsearch. It provides visualization capabilities on top of the content indexed on an Elasticsearch cluster. Therefore users can create bar, line and scatter plots, or pie charts and maps on top of large volumes of data.
It also provides a presentation tool, referred to as Canvas, that allows users to create slide decks that pull live data directly from Elasticsearch.
Elasticsearch is an open source data analysis tool. It can store very big amount of data and analyze it in milliseconds. Together with the aggregation engine its a great fit for every kind of data analysis job.
Elasticsearch is also the heart of the Elastic Stack (formely known as ELK stack).
Yes we provide all the Elastic content for free. Also if you would like to share something with the community this content will be available for free to everyone.
No. You can always download the content without the need of an Elastic Cloud account. Nevertheless if you would like to use the one click deploy option then you need an deployment in Elastic Cloud.









One comment
Comments are closed.