
Downloads from version 7.x Elasticsearch version specific download overview
Version 7.x downloads

Observability Kibana Dashboard
A single pane of glass dashboard for Logs, Metrics, APM data and business KPIs.

Detection engine alerts overview dashboard
Kibana Canvas dashboard that shows an aggregated view on the results of the detection engine in Elastic Security.

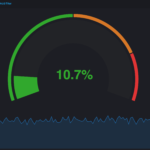
Vega Compound Gauge
This is a compund gauge visualization made with Vega. Its very helpful for visualization of percentage values.

Data flow canvas
This canvas examples shows some possibilities of how to visualize data flows. Every flow can be activated / deactivated based on your Elasticsearch data.
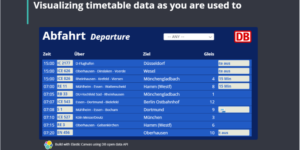
Timetable canvas
This canvas examples shows timetable data from trains. Its build based on the real world information panel in german trian stations. Its refreshing based on current time.
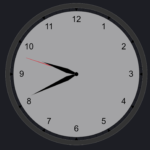
Traffic light using Vega
This traffic light visualizations is build with vega. The thresholds can be defined via values within the document itself.


Ask Me Anything Booth – Canvas Example
This is an example canvas page that shows how to visualize using canvas in general.