office-365-dashboard

Description

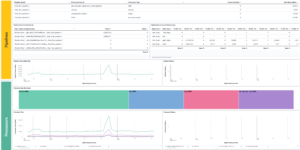
A collection of custom dashboards to give you a holistic view of your Microsoft 365 environment. These dashboards can help you answer the following questions and more:

  • What files are users sharing internally and externally and with who? Are there users uploading or downloading an unusually large amount of data?
  • Who invited or added a guest user? Were they invited through a shared file or added directly through Active Directory?
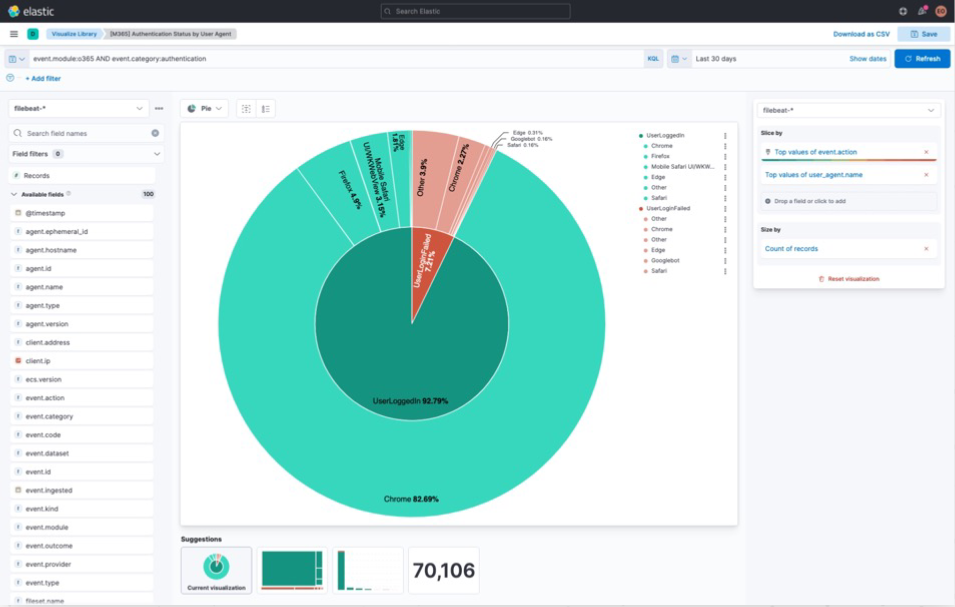
  • Where in the world are users logging in from? Are there suspicious user agents attempting to login?
  • Which users receive the most suspicious mail? Where is this mail coming from?
  • What users does Azure AD consider to be risky and why?

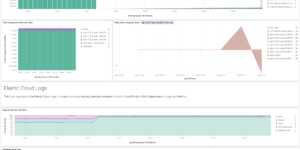
The download includes a couple of Elastic Kibana dashboard as well as runtime field code to improve the data that comes from OOTB Elastic modules. To show the data you need to run the Azure and Office 365 module or Elastic Agent integration.

What is Microsoft Office 365?

Microsoft 365 is the productivity cloud. The complete solution includes  office applications, intelligent cloud services and advanced security. Microsoft Office 365 environments usually containing a lot of important company information. Its very important to observe and protect the usage and the information there.

Source

Originally found at https://github.com/ironvine/elastic-m365

Can also downloaded from Github directly.

Tested versions 7.14, 7.15
ECS compliant Yes

You must log in to submit a review.

Related downloads

Ask Me Anything Booth – Canvas Example

This is an example canvas page that shows how to visualize using canvas in general.

Elastic Cloud Billing data collection and Kibana dashboard

Pulls Elastic Cloud Billing information from the Billing API then sends it to an Elasticsearch cluster and visualizes the results in Kibana dashboards.

Watcher History Dashboard

This dashboard shows the history of executed watcher jobs.

PI Hole Logstash Pipeline and Dashboard

A filter for Logstash parsing PI-Hole logs + Dashboard to visualize the data

Filebeat Log analysis canvas example

This is a simple canvas dashboard example that analyzes logs created by Filebeat.

Office display canvas example

Kibana canvas example showing an office screen with weather, news and stock information

These downloads could be also interesting for you

Watcher History Dashboard

This dashboard shows the history of executed watcher jobs.

Timetable canvas

This canvas examples shows timetable data from trains. Its build based on the real world information panel in german trian stations. Its refreshing based on current time.

CMDB dependency in Kibana Dashboard

Kibana vega example to show how to load visualize relationships between different infrastructure and network components in vega.

RUM extension dashboard

This dashboard provide deeper insight into the real user monitoring data collected by Elastic RUM.

Google Cloud monitoring dashboard

Dashboard to monitor GCP resources using different metrics and logs.

Observability Kibana Dashboard

A single pane of glass dashboard for Logs, Metrics, APM data and business KPIs.