

Using Elastic APM – Real User Monitoring to calculate the success of your web application
The Elastic Stack enables users to do many different use cases. Users can enhance their search features, their visibility into the application as well as the security of the application …

Detection engine alerts overview dashboard
Kibana Canvas dashboard that shows an aggregated view on the results of the detection engine in Elastic Security.
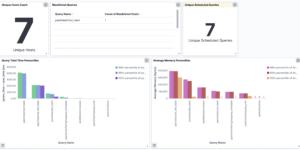


Kibana alerting enhancement
This bundle enhances the Kibana alerting experience. Storing all relevant information in indices and visualize the data in dashboards.
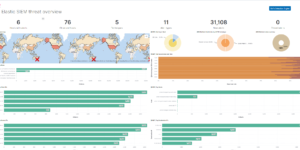
Threat detection Kibana dashboard
Kibana dashboard example visualizing the results of the Elastic SIEM detection engine
The search results are evaluated by ElasticPress using Elasticsearch clusters from Elastic Cloud.