TSVB Buttons

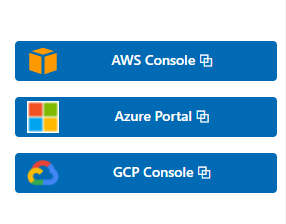
This visualization is an example of how to use buttons within Kibana dashboards. Its using custom CSS to style the buttons like normal Kibana buttons.

Its also using images and other elements for the links. The example is linking to AWS cloud portal, GCP portal and Azure portal. The links can easily be replaced by any link you like.

There are similar CSS styled elements used in our Kibana Observability dashboards.

If you like to link to different content based on the data that is shown in your dashboard its better to use drill downs.

Tested versions 7.x
ECS compliant No

You must log in to submit a review.

Related downloads

Sigma Zeek Detection rules

A collection of rules based on the Sigma rules for Zeek based on the Filebeat Zeek module.

Uptime watch using Heartbeat data

This watch checks the availability of your Heartbeat observed services. It will trigger an alert whenever at least one of your services is down.

Filebeat Log analysis canvas example

This is a simple canvas dashboard example that analyzes logs created by Filebeat.

RUM extension dashboard

This dashboard provide deeper insight into the real user monitoring data collected by Elastic RUM.

Crawler dashboard

A Kibana dashboard that visualizes the result of the crawler from Elastic Enterprise Search

Office display canvas example

Kibana canvas example showing an office screen with weather, news and stock information

These downloads could be also interesting for you

Elastic Cloud Monitoring dashboard

Kibana dashboard that uses the Elastic Cloud monitoring data to provide better insights into what’s happening in your cloud environment.

Kibana Maps with Open Weather Map

This is the default basemap of Kibana incl. the Open Weather Map tile for temperature, wind and pressure

Office display canvas example

Kibana canvas example showing an office screen with weather, news and stock information

Buttons for Kibana dashboards

Link to every content you want within your Kibana dashboards. This example is using links to cloud providers.

Filebeat Log analysis canvas example

This is a simple canvas dashboard example that analyzes logs created by Filebeat.

PI Hole Logstash Pipeline and Dashboard

A filter for Logstash parsing PI-Hole logs + Dashboard to visualize the data