
Dashboards Download overview
This is our collection of prebuilt Kibana Dashboards. Kibana is a great tool to visualize data stored in Elasticsearch. Kibana can act as the user interface for monitoring, SIEM and general data analytics. It includes a lot of OOTB visualizations and apps. Our Kibana Dashboards collection is an extension to the default visualizations. Using them dramatically helps to customize Kibana for your needs. Therefore its always a great idea to use them.
Dashboards downloads
PI Hole Logstash Pipeline and Dashboard
A filter for Logstash parsing PI-Hole logs + Dashboard to visualize the data

Filebeat Suricata Canvas dashboard
A Kibana Canvas dashboard example that visualizes suricata logs collected with Filebeat.

Filebeat Log analysis canvas example
This is a simple canvas dashboard example that analyzes logs created by Filebeat.

Office display canvas example
Kibana canvas example showing an office screen with weather, news and stock information

Observability Kibana Dashboard
A single pane of glass dashboard for Logs, Metrics, APM data and business KPIs.

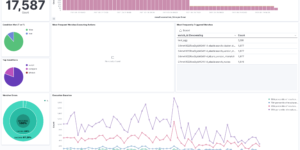
Detection engine alerts overview dashboard
Kibana Canvas dashboard that shows an aggregated view on the results of the detection engine in Elastic Security.

Data flow canvas
This canvas examples shows some possibilities of how to visualize data flows. Every flow can be activated / deactivated based on your Elasticsearch data.
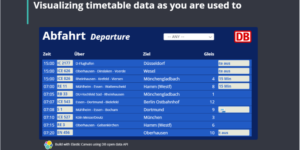
Timetable canvas
This canvas examples shows timetable data from trains. Its build based on the real world information panel in german trian stations. Its refreshing based on current time.
More about Dashboards
Kibana can be used for:
- Logging and log analytics
- Infrastructure metrics and container monitoring
- Application performance monitoring (APM)
- Geospatial data analysis and visualization
- Security analytics / SIEM
- Business analytics
A Kibana dashboard is a collection of charts, graphs, metrics, searches, and maps that have been collected together onto a single pane. Dashboards provide at-a-glance insights into data from multiple perspectives and enable users to drill down into the details.