Elastic Cloud dashboard

Description

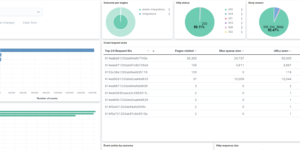
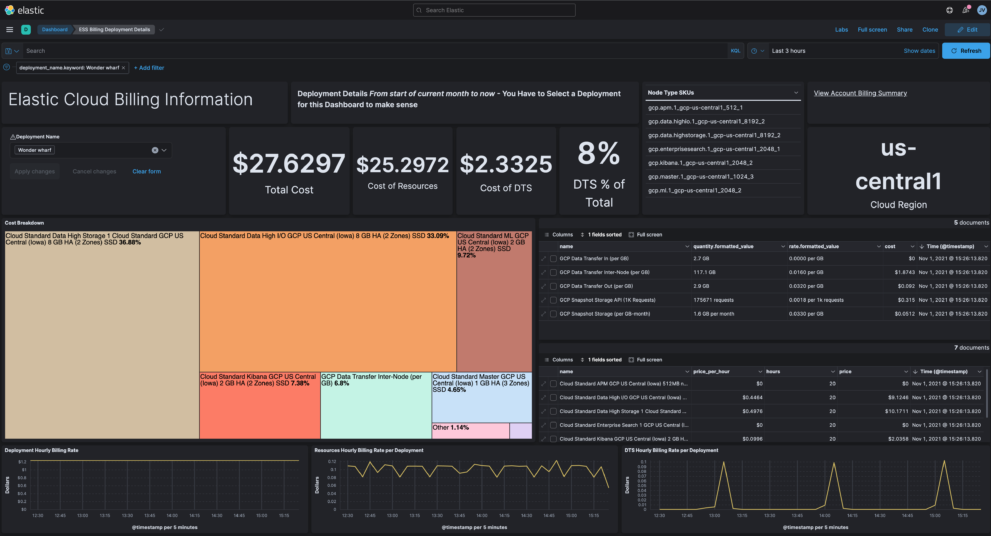
This download is visualizing billing information from Elastic Cloud in your Elastic Stack deployment. Its the ideal way to extend your monitoring cluster. The Elastic Cloud billing information including data about how much you spend per resource, cluster and or environment.

Depending on the section, info can include:

  • costs
    • total costs
    • hourly rate
    • DTS
  • resources
    • node type breakdown

You can find more information about the data that gets collected in the Elastic documentation. To collect the information you can use the script that is part of the source for this download. You can find that here.

Using the Elastic Cloud billing information you can analyse your costs and maybe find ways to reduce it.

Source

Originally found at GitHub: https://github.com/jeffvestal/ess-billing-ingest

Tested versions 7.15
ECS compliant No

You must log in to submit a review.

Related downloads

Ask Me Anything Booth – Canvas Example

This is an example canvas page that shows how to visualize using canvas in general.

Threat detection Kibana dashboard

Kibana dashboard example visualizing the results of the Elastic SIEM detection engine

Kibana alerting enhancement

This bundle enhances the Kibana alerting experience. Storing all relevant information in indices and visualize the data in dashboards.

Watcher History Dashboard

This dashboard shows the history of executed watcher jobs.

Cloudflare Kibana dashboards

Cloudflare dashboards and ingest pipelines to visualize cloudflare logs

PI Hole Logstash Pipeline and Dashboard

A filter for Logstash parsing PI-Hole logs + Dashboard to visualize the data

These downloads could be also interesting for you

Ask Me Anything Booth – Canvas Example

This is an example canvas page that shows how to visualize using canvas in general.

Elastic Stack Monitoring Dashboard

Kibana dashboards that is showing the monitoring data collected by Elastics in built monitoring capabilities.

Threat detection Kibana dashboard

Kibana dashboard example visualizing the results of the Elastic SIEM detection engine

Cloudflare Kibana dashboards

Cloudflare dashboards and ingest pipelines to visualize cloudflare logs

Kibana alerting enhancement

This bundle enhances the Kibana alerting experience. Storing all relevant information in indices and visualize the data in dashboards.

osquery performance dashboard

Kibana Dashboard example to visualize osquery performance