Description
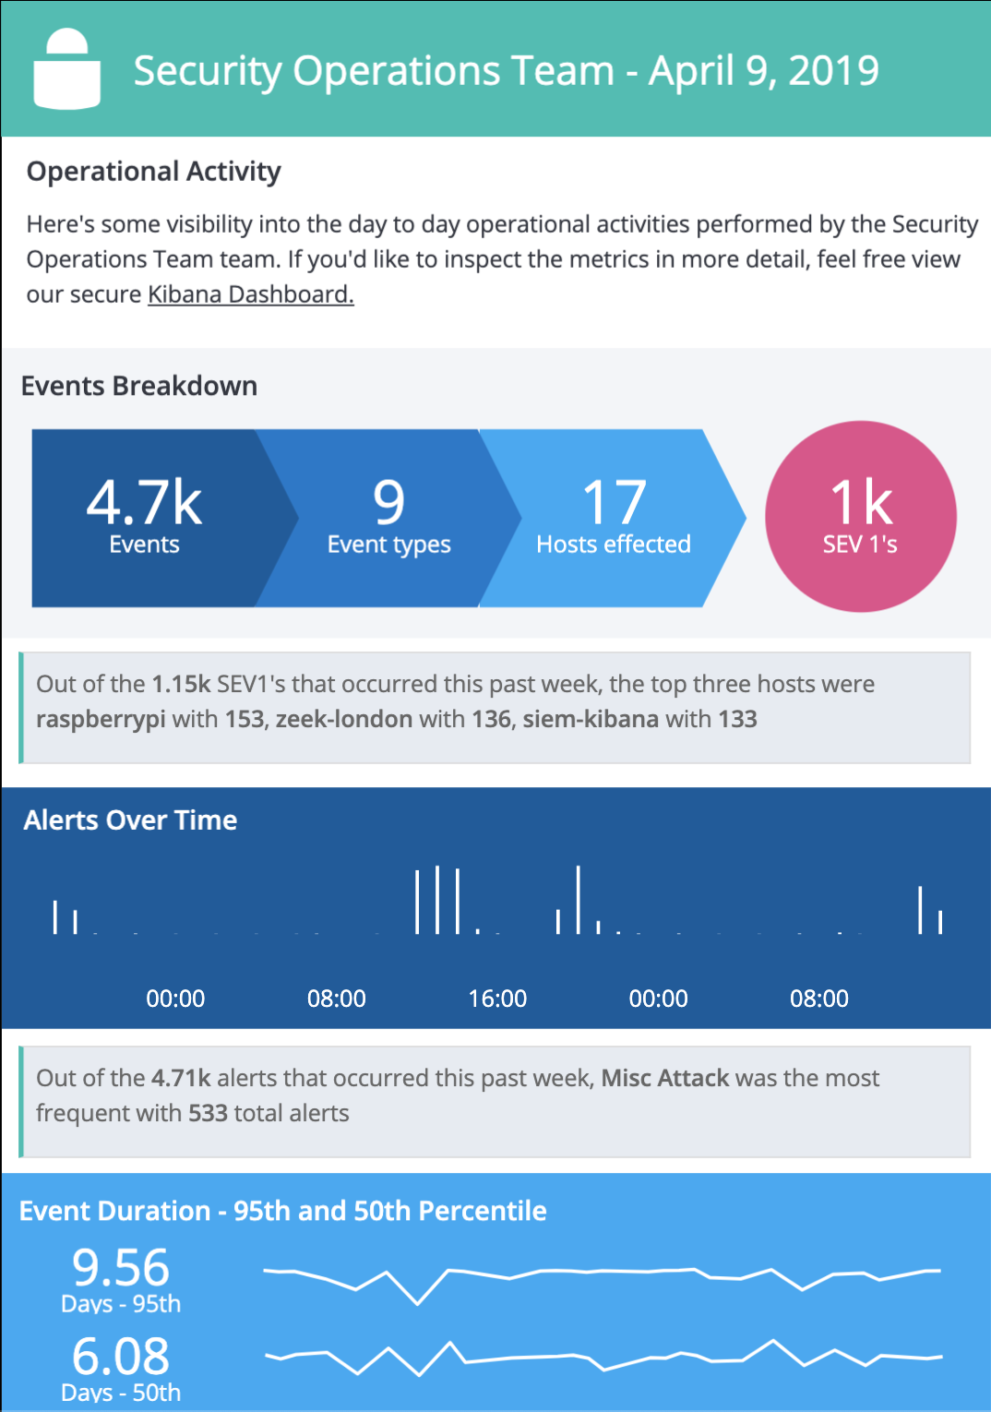
This Canvas dashboard is built on top of the Filebeat Suricata data. It provides a high level overview into the log data.
Suricata is a free, open source, mature, fast and powerful cyber threat detection engine. The Suricata engine is capable of real-time intrusion detection (IDS), inline intrusion prevention (IPS), network security monitoring (NSM) and offline pcap processing. Suricata uses powerful and extensive rules and signature language to inspect network traffic, and has powerful Lua script support to detect complex threats. With standard input and output formats such as YAML and JSON, and integration with existing tools like Logstash/Elasticsearch and Kibana. Suricata’s community drives rapid development, focusing on safety, usability, and efficiency. The Suricata project and code are owned and supported by the Open Information Security Foundation (OISF), a non-profit foundation dedicated to ensuring the development and continued success of Suricata as an open source project.
Filebeat comes with modules for observability and security data sources. These modules simplify the collection, parsing, and visualization of common log formats with just one command. They accomplish this by combining automatic default paths based on your operating system, Elasticsearch Ingest Node pipeline definitions, and Kibana dashboards. In addition, some Filebeat modules come with pre-configured machine learning jobs. Using the Filebeat Suricata module you also get the data pre parsed. You can take the result and visulize it in the dashboard that comes with the filebeat module or use this Canvas dashboard example in addition to that.
| Tested versions | 7.x |
| ECS compliant |
You must log in to submit a review.