Lens Conversion Rate

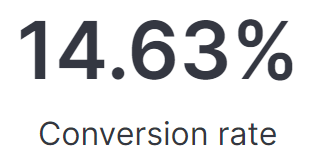
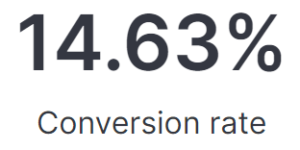
This visualization is using Lens formulas to calculate the conversion rate of any web application based on real user monitoring data. This is part of the this blog article about real user monitoring.

After uploading this visualization into your environment you need to make sure to define the pages that reflecting successful conversions. Do this by simply adapting the value in the lens formula box.

Tested versions 7.14
ECS compliant Yes

You must log in to submit a review.
Related downloads

RUM extension dashboard

This dashboard provide deeper insight into the real user monitoring data collected by Elastic RUM.

Lens Conversion Rate

Lens conversion rate for RUM data using Lens Formulas

APM Services overview canvas

Average rating:

An adaptive turn key canvas example based on Elastic APM data.

These downloads could be also interesting for you

Office 365 dashboards

A collection of Kibana dashboards to provide a holistic view of Microsoft Office 365 environments

Observability Kibana Dashboard

A single pane of glass dashboard for Logs, Metrics, APM data and business KPIs.

Watcher History Dashboard

This dashboard shows the history of executed watcher jobs.

Traffic light using Vega

This traffic light visualizations is build with vega. The thresholds can be defined via values within the document itself.

RUM extension dashboard

This dashboard provide deeper insight into the real user monitoring data collected by Elastic RUM.

ACSC Advisory IOCs detection rules

ACSC Advisory IOCs detection rules for Elastic SIEM