Lens Conversion Rate

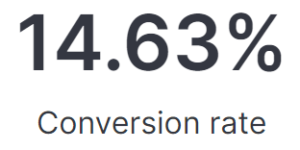
This visualization is using Lens formulas to calculate the conversion rate of any web application based on real user monitoring data. This is part of the this blog article about real user monitoring.

After uploading this visualization into your environment you need to make sure to define the pages that reflecting successful conversions. Do this by simply adapting the value in the lens formula box.

Tested versions 7.14
ECS compliant Yes

You must log in to submit a review.

Related downloads

Lens Conversion Rate

Lens conversion rate for RUM data using Lens Formulas

RUM extension dashboard

This dashboard provide deeper insight into the real user monitoring data collected by Elastic RUM.

APM Services overview canvas

Average rating:

An adaptive turn key canvas example based on Elastic APM data.

These downloads could be also interesting for you

Kibana alerting enhancement

This bundle enhances the Kibana alerting experience. Storing all relevant information in indices and visualize the data in dashboards.

Sigma AWS Cloudtrail Detection rules

A collection of rules based on the Sigma rules for AWS based on the Filebeat AWS module and Elastic agent integration.

AWS Cloudtrail Monitoring dashboard

Deep insights into AWS Cloudtrail events for SIEM and Monitoring

Vega Clock UTC

This is a working clock visualization in UTC time.

CMDB dependency in Kibana Dashboard

Kibana vega example to show how to load visualize relationships between different infrastructure and network components in vega.

Vega Compound Gauge

This is a compund gauge visualization made with Vega. Its very helpful for visualization of percentage values.