Logstash Downloads

Description

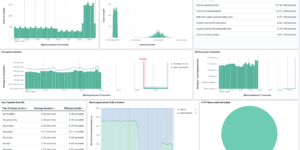
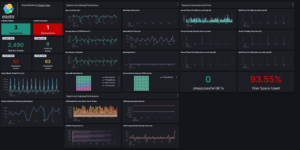
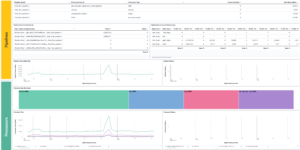
This download includes a Logstash pipeline and corresponding Kibana Dashboard to parse and visualize PI-Hole Logs.

What is PI-Hole?

Pi-hole or Pihole is a Linux network-level advertisement and Internet tracker blocking application which acts as a DNS sinkhole and optionally a DHCP server, intended for use on a private network. It is designed for low-power embedded devices with network capability, such as the Raspberry Pi, but supports any Linux machines.

Pi-hole has the ability to block traditional website advertisements as well as advertisements in unconventional places, such as smart TVs and mobile operating system advertisements.

Source

Originally found at https://gist.github.com/iamhowardtheduck/

Tested versions 7.x, 7.12
ECS compliant Yes

You must log in to submit a review.

Related downloads

Threat detection Kibana dashboard

Kibana dashboard example visualizing the results of the Elastic SIEM detection engine

Kibana alerting enhancement

This bundle enhances the Kibana alerting experience. Storing all relevant information in indices and visualize the data in dashboards.

Elasticsearch Performance Troubleshooting Kit

Download the Elasticsearch Performance Troubleshooting Kit to efficiently diagnose and resolve slow query issues in your Elasticsearch environment.

osquery performance dashboard

Kibana Dashboard example to visualize osquery performance

Office 365 dashboards

A collection of Kibana dashboards to provide a holistic view of Microsoft Office 365 environments

Elastic Cloud Billing data collection and Kibana dashboard

Pulls Elastic Cloud Billing information from the Billing API then sends it to an Elasticsearch cluster and visualizes the results in Kibana dashboards.

These downloads could be also interesting for you

PI Hole Logstash Pipeline and Dashboard

A filter for Logstash parsing PI-Hole logs + Dashboard to visualize the data

osquery performance dashboard

Kibana Dashboard example to visualize osquery performance

Google Cloud monitoring dashboard

Dashboard to monitor GCP resources using different metrics and logs.

Ingest Pipeline Monitoring

This Kibana dashboard can be used monitor your ingest pipelines

Resource Optimization Dashboard

Elastic Resource Optimization Dashboard to seamlessly integrate APM insights with cloud cost data for actionable resource management and cost-saving strategies

Kubernetes architecture overview

Vega visualization to show the dependencies between the different Kubernetes components in a single visualization