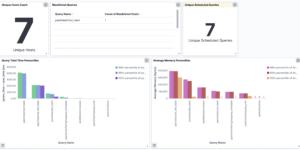
Postfix Mail Server Dashboard
Keep an eye on your Postfix mail server performance and security.
This dashboard set helps you visualize:
- Mail Flow: Incoming vs. outgoing volume.
- Rejections: Blocked emails, spam attempts, and policy violations.
- Errors: SMTP errors and connection issues.
- Geography: Source and destination maps for mail traffic.
Contents: ‘api-combined.ndjson’ containing all necessary saved objects.
Source: ActionScripted/elastic-kibana-postfix
| Tested versions | |
| ECS compliant |
You must log in to submit a review.