Description
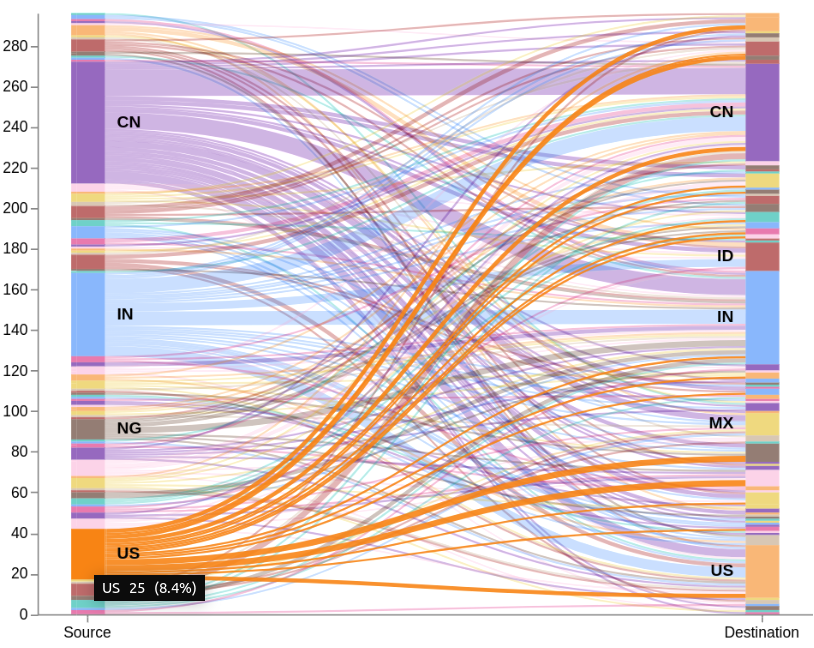
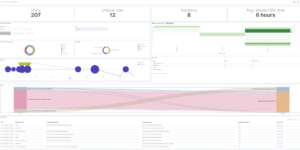
This is an example of how to build an sankey visualization using the vega visualization in Kibana. This vega example has three versions of the sankey visualization. Its an 2 Level, 4 Level and 7 Level example. A Sankey visualization is a great way to show the movement of users through your application. It can also be used for any other kind of data representation that is based on multiple levels and each level has an defined start and ending point.
A Sankey chart is a kind of stream chart with the width of the lines shown relatively to the stream amount. Every passage in the example information has source and objective nation code. The chart will have two modes: all-to-all (default), in addition to it will permit clients to choose either the source or the objective nation, and show just related traffic.
Remarks
This download is not able to run immediately. But its easy to adapt to your needs. You only need to change the index to search in and also the fields that contain the source and the destination information.
Make sure source and destination contain similar values to make it work.
Source
If you wanna learn more about that check this blog which is the source for that example:
https://www.elastic.co/de/blog/sankey-visualization-with-vega-in-kibana
| Tested versions | |
| ECS compliant |
You must log in to submit a review.

