Vega Compound gauge

Description

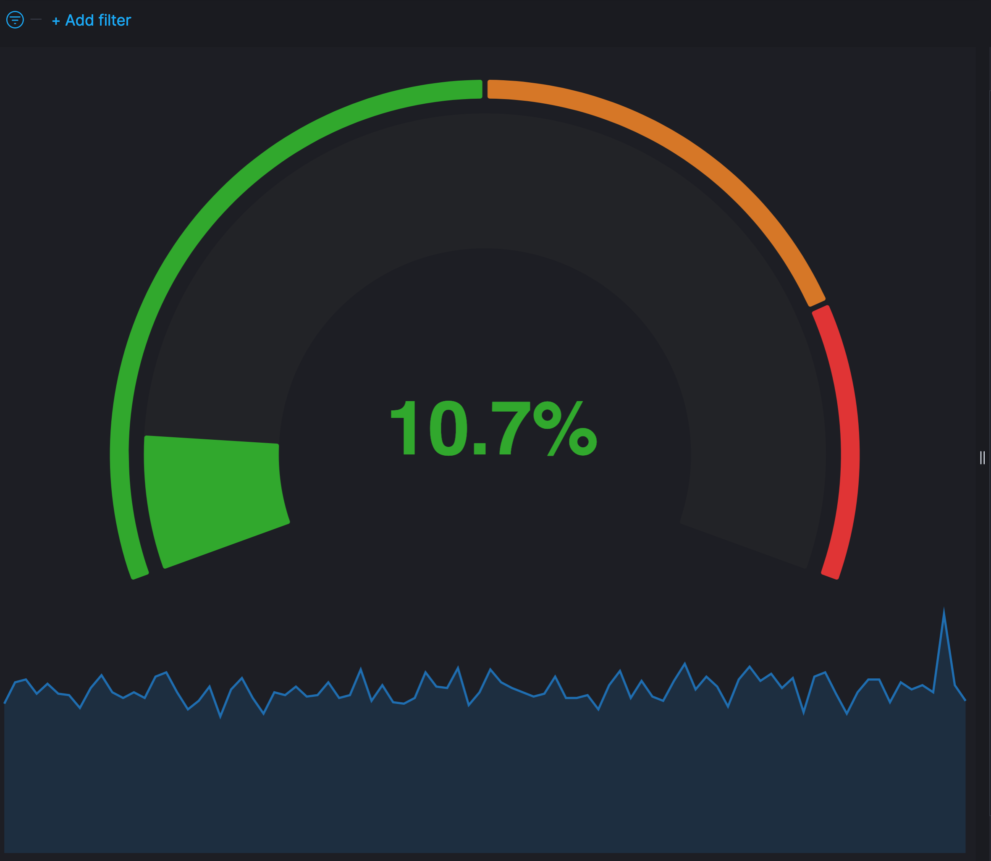
These are Compound Gauges made with Vega. The download includes two examples. The examples are made with ECS compliant metric data. You can either use the system integration package of the Elastic Agent or Metricbeat with the system module. Both will show you results. If you don’t have a metric index your deployment you will see an error message.

Compound Percent Gauge

This one is good for percent values like Percent CPU. Configure the colors and the steps base on your needs.

Compound Value Gauge

This one is good for values like Load Average. While any metric can be used its always good to know the range the values will be in.

Tested versions 7.x
ECS compliant

You must log in to submit a review.
Related downloads

osquery performance dashboard

Kibana Dashboard example to visualize osquery performance

Sigma Elastic SIEM rules for web server logs

A collection of rules based on the Sigma detection rules for web server looks, e.g. apache, nginx or IIS.

Resource Optimization Dashboard

Elastic Resource Optimization Dashboard to seamlessly integrate APM insights with cloud cost data for actionable resource management and cost-saving strategies

Threat detection Kibana dashboard

Kibana dashboard example visualizing the results of the Elastic SIEM detection engine

APM Services overview canvas

Average rating:

An adaptive turn key canvas example based on Elastic APM data.

Elastic Cloud Billing data collection and Kibana dashboard

Pulls Elastic Cloud Billing information from the Billing API then sends it to an Elasticsearch cluster and visualizes the results in Kibana dashboards.

These downloads could be also interesting for you

Office 365 dashboards

A collection of Kibana dashboards to provide a holistic view of Microsoft Office 365 environments

Watcher History Dashboard

This dashboard shows the history of executed watcher jobs.

Elasticsearch Performance Troubleshooting Kit

Download the Elasticsearch Performance Troubleshooting Kit to efficiently diagnose and resolve slow query issues in your Elasticsearch environment.

Google Cloud monitoring dashboard

Dashboard to monitor GCP resources using different metrics and logs.

Filebeat Log analysis canvas example

This is a simple canvas dashboard example that analyzes logs created by Filebeat.