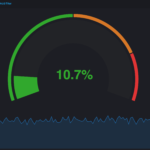
Vega Compound gauge

Description

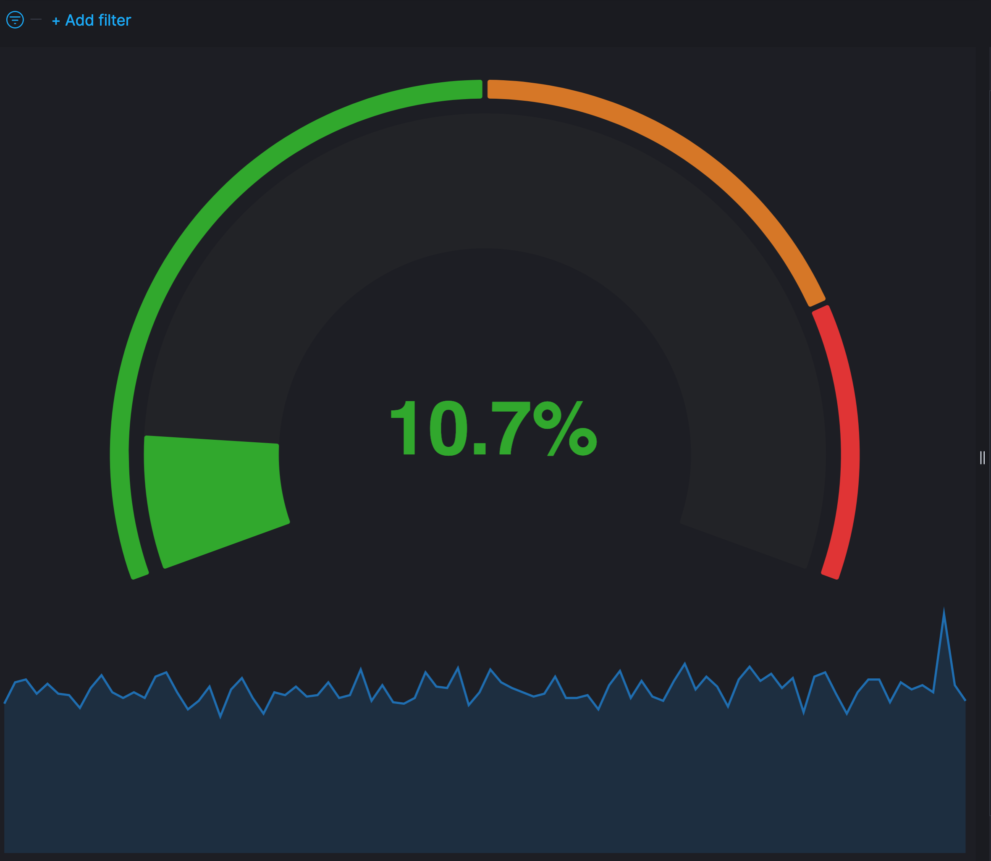
These are Compound Gauges made with Vega. The download includes two examples. The examples are made with ECS compliant metric data. You can either use the system integration package of the Elastic Agent or Metricbeat with the system module. Both will show you results. If you don’t have a metric index your deployment you will see an error message.

Compound Percent Gauge

This one is good for percent values like Percent CPU. Configure the colors and the steps base on your needs.

Compound Value Gauge

This one is good for values like Load Average. While any metric can be used its always good to know the range the values will be in.

Tested versions 7.x
ECS compliant

You must log in to submit a review.
Related downloads

RUM extension dashboard

This dashboard provide deeper insight into the real user monitoring data collected by Elastic RUM.

Vega advanced heat map

Vega example to show GitHub commits per author per hour of day.

CMDB dependency in Kibana Dashboard

Kibana vega example to show how to load visualize relationships between different infrastructure and network components in vega.

Resource Optimization Dashboard

Elastic Resource Optimization Dashboard to seamlessly integrate APM insights with cloud cost data for actionable resource management and cost-saving strategies

Kubernetes architecture overview

Vega visualization to show the dependencies between the different Kubernetes components in a single visualization

Cloudflare Kibana dashboards

Cloudflare dashboards and ingest pipelines to visualize cloudflare logs

These downloads could be also interesting for you

Sigma Elastic SIEM rules for web server logs

A collection of rules based on the Sigma detection rules for web server looks, e.g. apache, nginx or IIS.

Elastic Cloud Monitoring dashboard

Kibana dashboard that uses the Elastic Cloud monitoring data to provide better insights into what’s happening in your cloud environment.

Watcher History Dashboard

This dashboard shows the history of executed watcher jobs.

Detection engine alerts overview dashboard

Average rating:

Kibana Canvas dashboard that shows an aggregated view on the results of the detection engine in Elastic Security.

Kibana Enhanced Table plugin

Data Table visualization with enhanced features like computed columns, pivot table or filter bar