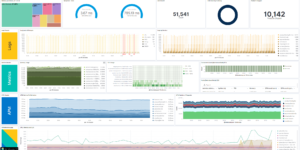
Vega Compound gauge

Description

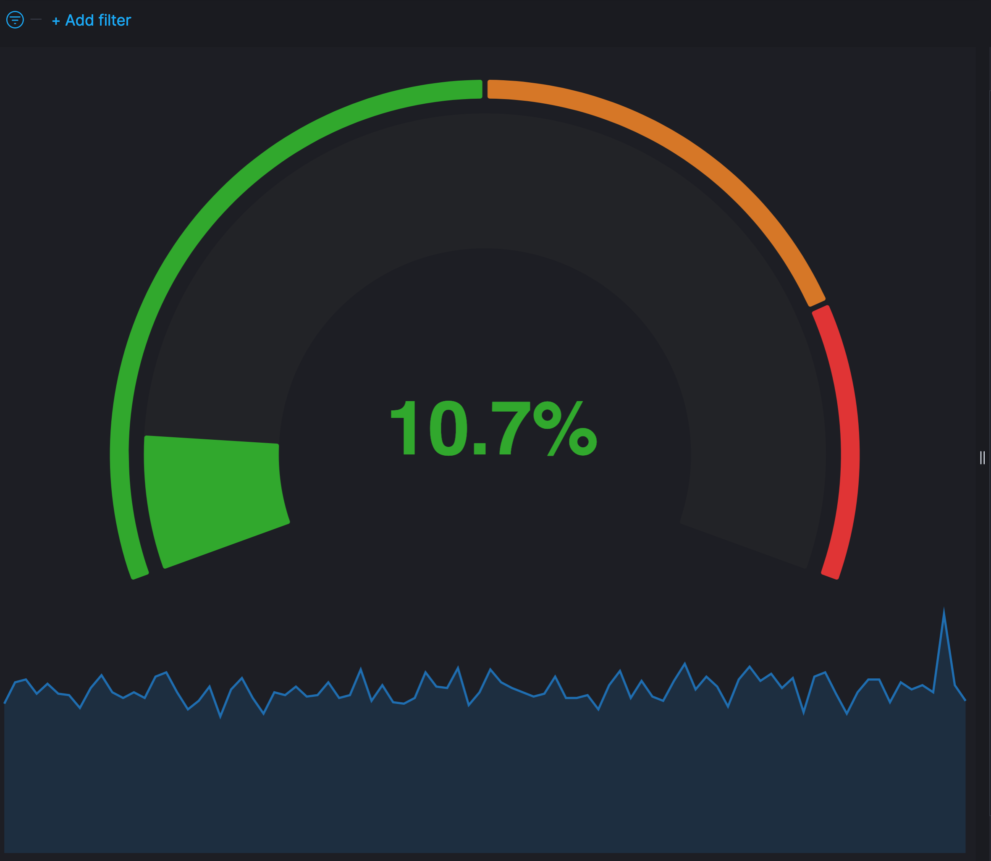
These are Compound Gauges made with Vega. The download includes two examples. The examples are made with ECS compliant metric data. You can either use the system integration package of the Elastic Agent or Metricbeat with the system module. Both will show you results. If you don’t have a metric index your deployment you will see an error message.

Compound Percent Gauge

This one is good for percent values like Percent CPU. Configure the colors and the steps base on your needs.

Compound Value Gauge

This one is good for values like Load Average. While any metric can be used its always good to know the range the values will be in.

Tested versions 7.x
ECS compliant

You must log in to submit a review.
Related downloads

Vega advanced heat map

Vega example to show GitHub commits per author per hour of day.

Elastic Cloud Billing data collection and Kibana dashboard

Pulls Elastic Cloud Billing information from the Billing API then sends it to an Elasticsearch cluster and visualizes the results in Kibana dashboards.

Filebeat Log analysis canvas example

This is a simple canvas dashboard example that analyzes logs created by Filebeat.

Resource Optimization Dashboard

Elastic Resource Optimization Dashboard to seamlessly integrate APM insights with cloud cost data for actionable resource management and cost-saving strategies

osquery performance dashboard

Kibana Dashboard example to visualize osquery performance

Google Cloud monitoring dashboard

Dashboard to monitor GCP resources using different metrics and logs.

These downloads could be also interesting for you

Kibana Maps with Open Weather Map

This is the default basemap of Kibana incl. the Open Weather Map tile for temperature, wind and pressure

Coffee Canvas Example

Kibana Canvas example infographic to show coffee consumption on a wallboard

Terraform Elasticsearch environments

Terraform example scripts to deploy Elastic Cloud Clusters + all necessary components in AWS and GCP

Elastic Cloud Monitoring dashboard

Kibana dashboard that uses the Elastic Cloud monitoring data to provide better insights into what’s happening in your cloud environment.

AWS Cloudtrail Monitoring dashboard

Deep insights into AWS Cloudtrail events for SIEM and Monitoring