How to use the elastic content share?
You are looking for prebuilt content to use it in your Elastic environment like Kibana dashboards, Watcher alerting rules or extensions to your observability solution? If you are a user of the Elastic SIEM as part of your Elastic Security solution you can also extend the OOTB detection engines rules. Download prebuild Kibana dashboards now instead of creating it on your own!
The elastic-content-share offers a wide variety of Elastic based content from Elastic users for Elastic users. Feel free to look around in our Download area what others has created for you. If you are content creator we would be more than happy if you would share your stuff here for the rest of world.
Deploy in seconds

The downloads you can find here can be deployed within seconds into your Elastic Cloud deployment.
Share your content

If you made a dashboard that you are proud of just share it with the Elastic community.
Learn Elastic

Use our examples and video database to learn more about how to use Elastic in your environment successfully.
Start downloading ELK Stack content now
Downloading and using Elastic content is easy. For any part of the ELK stack you are able to download relevant content here. You can have a look into specific categories or just looking at all our downloads at once.
Top contributions
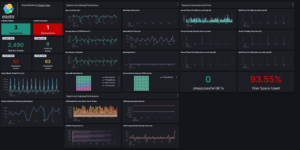
Elastic Stack Monitoring Dashboard
Kibana dashboards that is showing the monitoring data collected by Elastics in built monitoring capabilities.
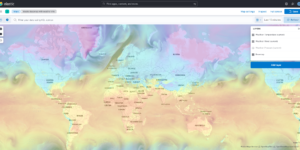
Kibana Maps with Open Weather Map
This is the default basemap of Kibana incl. the Open Weather Map tile for temperature, wind and pressure
Sigma Windows inbuilt detection rules
A collection of rules based on the Sigma rules for Windows (inbuilt folder) based on Winlogbeat data .
Extensions for every part of your ELK stack
Latest contributions
Elastic Stack Monitoring Dashboard
Kibana dashboards that is showing the monitoring data collected by Elastics in built monitoring capabilities.
Kubernetes architecture overview
Vega visualization to show the dependencies between the different Kubernetes components in a single visualization
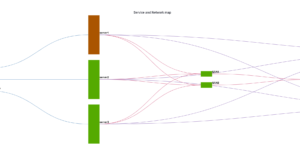
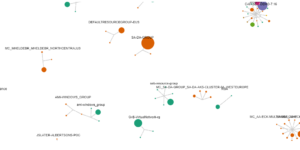
CMDB dependency in Kibana Dashboard
Kibana vega example to show how to load visualize relationships between different infrastructure and network components in vega.
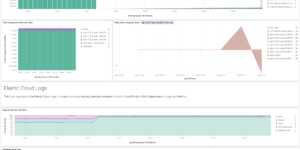
Elastic Cloud Monitoring dashboard
Kibana dashboard that uses the Elastic Cloud monitoring data to provide better insights into what’s happening in your cloud environment.
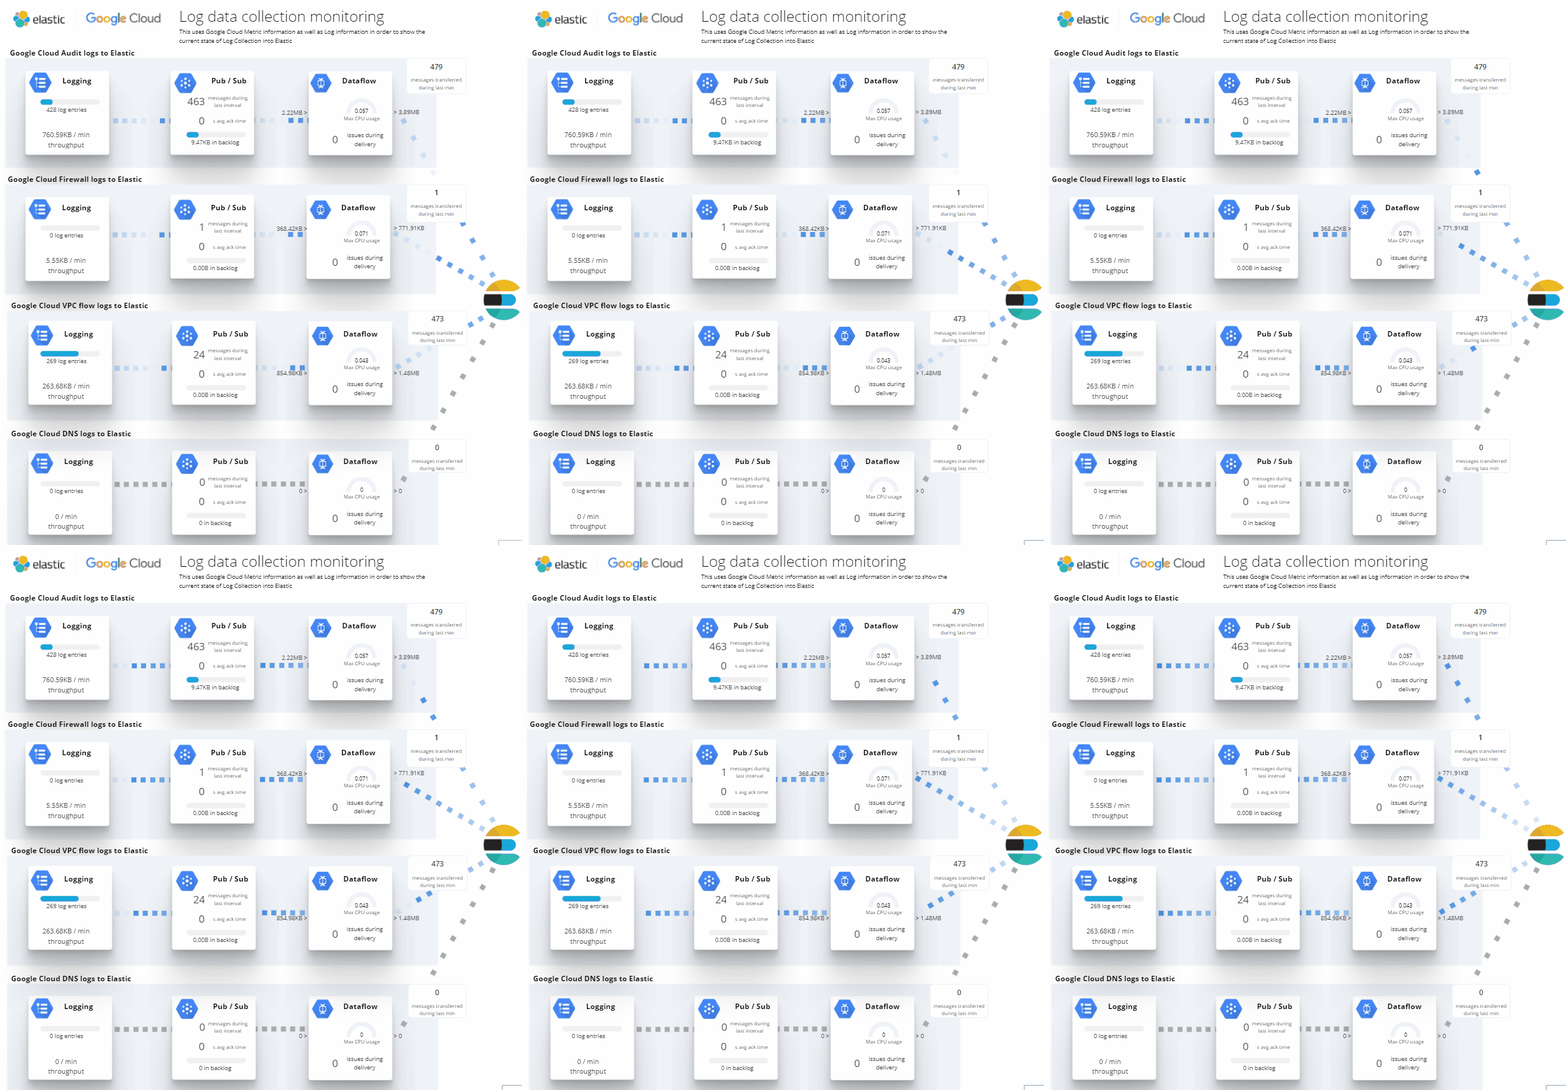
Google Cloud Log Ingestion dashboard
Canvas Board to analyze the log data collection of Google Cloud via Dataflow using the Google Cloud Metric module data
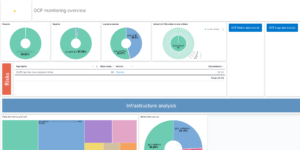
Google Cloud monitoring dashboard
Dashboard to monitor GCP resources using different metrics and logs.
Azure billing data network
A vega visualization that shows the connection between resource group, resource type and the resource itself based on Elastic agent azure billing data integration.
Buttons for Kibana dashboards
Link to every content you want within your Kibana dashboards. This example is using links to cloud providers.
Download prebuilt Kibana dashboards is a great way to quickly start using Elastic in production. Kibana comes with a lot of prebuilt dashboards and templates. But its always good to see what others are using.
The Elastic Content Share provides content for Kibana like Dashboards, Visualizations and Canvas Boards. We also provide content for Elasticsearch like Watcher rules and specific mappings. Another important part is Logstash. For Logstash we provide prebuilt pipelines for different data sources. Elastic offers three different solutions based on the ELK stack, its Elastic Enterprise Search, Elastic Observability and Elastic Security. While this is great the users of Elastic Stack can do much more with it. In our blog articles you find many examples of how you could leverage the power of the Elastic Stack for your needs.
FAQ about download prebuilt Kibana dashboards
The Elastic Content Share is a platform to share content like Monitoring Dashboards for all the products offered by Elastic. These products are Kibana, Elasticsearch, Logstash and Beats. We also offer our help for any Elastic specific request you have.
No, the Elastic Content Share is a project from the community. It is not officially released nor maintained by elastic.
You will find official elastic offerings at elastic.co
Kibana is an open source data visualization dashboard for Elasticsearch. It provides visualization capabilities on top of the content indexed on an Elasticsearch cluster. Therefore users can create bar, line and scatter plots, or pie charts and maps on top of large volumes of data.
It also provides a presentation tool, referred to as Canvas, that allows users to create slide decks that pull live data directly from Elasticsearch.
Elasticsearch is an open source data analysis tool. It can store very big amount of data and analyze it in milliseconds. Together with the aggregation engine its a great fit for every kind of data analysis job.
Elasticsearch is also the heart of the Elastic Stack (formely known as ELK stack).
Yes we provide all the Elastic content for free. Also if you would like to share something with the community this content will be available for free to everyone.
No. You can always download the content without the need of an Elastic Cloud account. Nevertheless if you would like to use the one click deploy option then you need an deployment in Elastic Cloud.







One comment
Comments are closed.