UberAgent Monitoring Suite

This extensive collection of dashboards provides deep visibility into your infrastructure using UberAgent data.
It covers a wide range of use cases including:

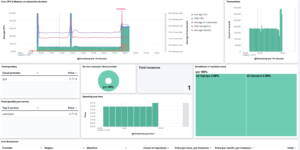
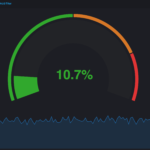
  • User Experience Monitoring: Logon duration, application performance, and browser usage.
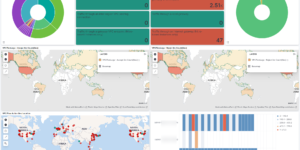
  • Infrastructure Monitoring: Machine performance, GPU usage, and storage analysis.
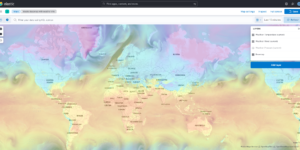
  • Network Visibility: Detailed network communication and Citrix ADC performance.
  • Security: UberAgent ESA dashboards for threat detection.

Contents: A complete set of NDJSON dashboards ready for import into Kibana.

Source: xoap-io/xoap-uberagent-kibana-dashboards

Tested versions
ECS compliant

You must log in to submit a review.

Related downloads

Sigma Zeek Detection rules

A collection of rules based on the Sigma rules for Zeek based on the Filebeat Zeek module.

Coffee Canvas Example

Kibana Canvas example infographic to show coffee consumption on a wallboard

Elastic Stack Monitoring Dashboard

Kibana dashboards that is showing the monitoring data collected by Elastics in built monitoring capabilities.

Watch to detect large shards

This watch is getting data from the Elasticsearch shards API directly and checking for large shards.

AWS Cloudtrail Monitoring dashboard

Deep insights into AWS Cloudtrail events for SIEM and Monitoring

Move to next ILM phase Watcher

This watcher job is moving specific indices based on e.g. disc usage into the next ILM phase.

These downloads could be also interesting for you

Playable Pacman

This is a playable version of pacman made with Vega.

Sigma Windows Process Creation detection rules

A collection of rules based on the Sigma rules for Windows (process creation folder) based on Winlogbeat data .

APM Services overview canvas

Average rating:

An adaptive turn key canvas example based on Elastic APM data.

PI Hole Logstash Pipeline and Dashboard

A filter for Logstash parsing PI-Hole logs + Dashboard to visualize the data

UberAgent Monitoring Suite

Comprehensive dashboard suite for UberAgent data in Kibana/OpenSearch.

Vega advanced heat map

Vega example to show GitHub commits per author per hour of day.