azure-graph network with vega

Description

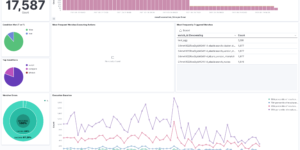
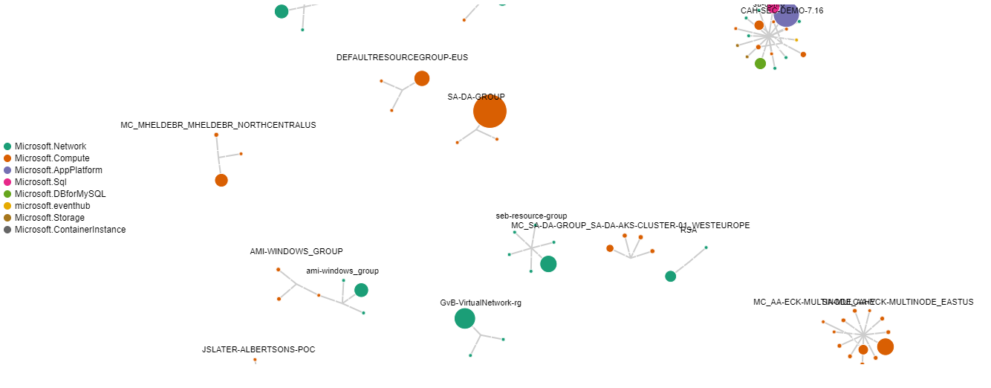
This Kibana vega example is using the Azure billing data integration from Elastic Agent to visualize the connections between azure resource groups, azure resource types and the resources itself based on the billing data. This results in an Azure billing data network for your used resources.

It is very helpful to analyze to costs that are generated within azure and can be used to get a high level overview about the different resources being used and the amount of money it takes to run them.

Its build based on the Vega Force Directed Layout example. I also used this adaption of the example that is already using Elasticsearch data as input. The second example is visualizing the connections between different IPs and the used protocols which can be very helpful to extend Elastic Security use cases.

Using this Kibana Vega example you can learn

  • How to use Elasticsearch data to visualize with Vega
  • How to effectively use transforms to prepare your data for visualization purposes
  • How to work with customized tooltips within Kibana

Tested versions 8.x
ECS compliant Yes

You must log in to submit a review.

Related downloads

osquery performance dashboard

Kibana Dashboard example to visualize osquery performance

Filebeat Log analysis canvas example

This is a simple canvas dashboard example that analyzes logs created by Filebeat.

Watcher History Dashboard

This dashboard shows the history of executed watcher jobs.

Office display canvas example

Kibana canvas example showing an office screen with weather, news and stock information

Vega Compound Gauge

This is a compund gauge visualization made with Vega. Its very helpful for visualization of percentage values.

Elastic Stack Monitoring Dashboard

Kibana dashboards that is showing the monitoring data collected by Elastics in built monitoring capabilities.

These downloads could be also interesting for you

Sigma Zeek Detection rules

A collection of rules based on the Sigma rules for Zeek based on the Filebeat Zeek module.

CMDB dependency in Kibana Dashboard

Kibana vega example to show how to load visualize relationships between different infrastructure and network components in vega.

Timetable canvas

This canvas examples shows timetable data from trains. Its build based on the real world information panel in german trian stations. Its refreshing based on current time.

Kibana Maps with Open Weather Map

This is the default basemap of Kibana incl. the Open Weather Map tile for temperature, wind and pressure

osquery performance dashboard

Kibana Dashboard example to visualize osquery performance

Kubernetes architecture overview

Vega visualization to show the dependencies between the different Kubernetes components in a single visualization