Security detections overview

Description

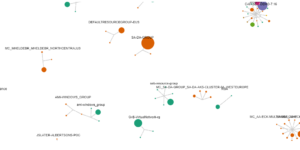
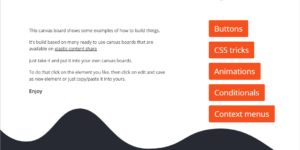
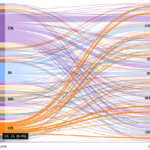
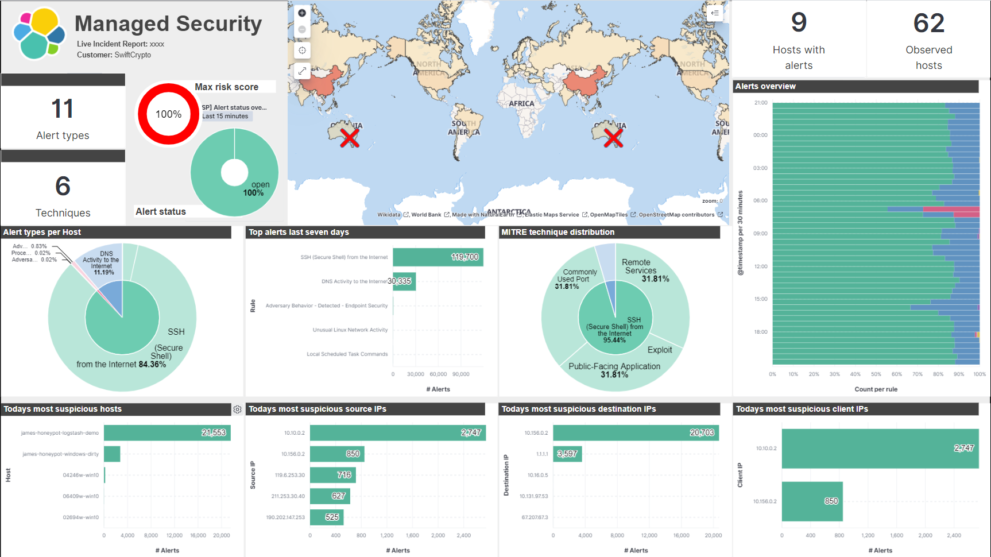
This Kibana Canvas Board aggregates the data of the Detection Engine that is part of Elastic Security. It comes we a set of pre build Kibana Lens visualizations that are aggregating the data. The user can decide to got with the Kibana Canvas board or use the visualizations to work with a normal Kibana Dashboard.

You will receive more than 10 visualizations + 2 index patterns next to the Canvas board.#

The Detection Engine of Elastic Security is detection suspicious behavior based on the MITRE ATTACK Framework. Its a very powerful tool to detect threats in the security related data that has been collected with the Elastic Stack. Nevertheless there is no out of the box view that shows the results of the alerts in an aggregated fashion. Thatswhy I build this Kibana dashboard to help users to understand the current situation.

Tested versions 7.11, 7.12, 7.13
ECS compliant Yes

Reviews

  • Great dashboard

    This dashboard really helps to aggregate the results of the detection engine. Now I always start looking at this dashboard and working myself through the open alerts.

    Thank you for your feedback.

    209 of 397 people found this review helpful.

  • Error on import

    Hi !

    I tried to import the dashboard in 7.10.2 and get an error regarding tag. As far as I know there is only in 7.11 tags. Is there a version for 7.10.2 available ?

    Thanks

    200 of 419 people found this review helpful.

    Help other customers find the most helpful reviews

    Did you find this review helpful? Yes No

  • You must log in to submit a review.

    Related downloads

    Office 365 dashboards

    A collection of Kibana dashboards to provide a holistic view of Microsoft Office 365 environments

    Detection engine alerts overview dashboard

    Average rating:

    Kibana Canvas dashboard that shows an aggregated view on the results of the detection engine in Elastic Security.

    Azure billing data network

    A vega visualization that shows the connection between resource group, resource type and the resource itself based on Elastic agent azure billing data integration.

    APM Services overview canvas

    Average rating:

    An adaptive turn key canvas example based on Elastic APM data.

    Kibana Canvas examples collection

    Average rating:

    A collection of canvas examples, like using conditionals, creating buttons, animations or context menues. Just copy paste into your Kibana Canvas project.

    Office display canvas example

    Kibana canvas example showing an office screen with weather, news and stock information

    These downloads could be also interesting for you

    Timetable canvas

    This canvas examples shows timetable data from trains. Its build based on the real world information panel in german trian stations. Its refreshing based on current time.

    Vega Compound Gauge

    This is a compund gauge visualization made with Vega. Its very helpful for visualization of percentage values.

    Sankey visualization example

    This is an example of how to build an sankey visualization using the vega visualization in Kibana.

    Vega Clock UTC

    This is a working clock visualization in UTC time.

    Lens Conversion Rate

    Lens conversion rate for RUM data using Lens Formulas

    Kibana Enhanced Table plugin

    Data Table visualization with enhanced features like computed columns, pivot table or filter bar