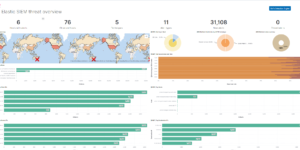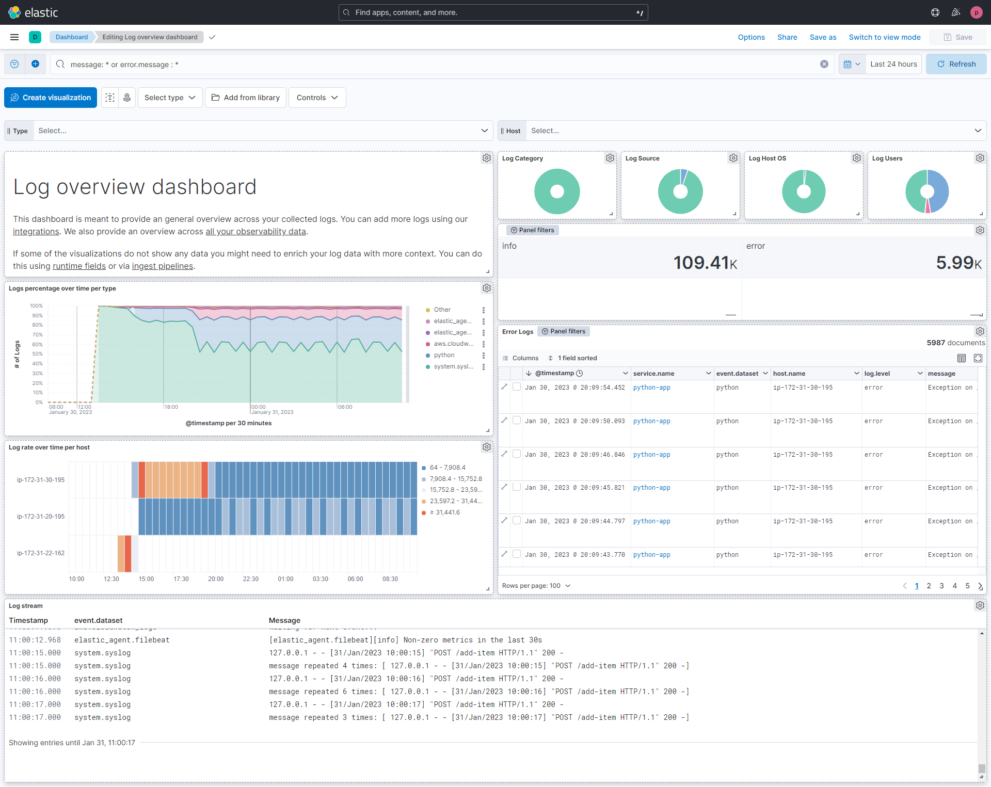
Description
This dashboard shows all the information that is collected by your logs. It is meant as a general overview about your logs so that you can have a condensed view across everything. Logs in Elasticsearch can be collected via Filebeat, Elastic Agent or directly using Logstash and other data streaming tools. The ELK stack is very famous for its ability to analyze your log data.
How to perform log analytics with the ELK stack in 2023?
The ELK stack (Elasticsearch, Logstash, and Kibana) is a popular open-source log analytics platform. To perform log analytics with the latest version of the ELK stack:
- Collect log data: Use Elastic Agent to collect log data from various sources, such as servers, applications, and devices.
- Store log data: Store log data in Elasticsearch, which is a distributed and scalable search and analytics engine.
- Analyze and visualize log data: Use Kibana to analyze and visualize the log data stored in Elasticsearch. Kibana provides a variety of visualization options, such as charts, graphs, and tables, which make it easy to explore and understand the log data.
- Create dashboards and alerts: Create custom dashboards and alerts in Kibana to monitor specific log data and receive notifications when certain conditions are met.
- Analyze log data using machine learning: Use the built-in machine learning capabilities in Elasticsearch to identify patterns and trends in log data, and gain deeper insights into your technology stack.
What is a log analytics dashboard?
A log analytics dashboard is a tool that displays data from logs in a visually appealing and easy to understand manner. The purpose of log analytics is to allow organizations to monitor and analyze log data from various sources, including servers, applications, and devices, to identify trends, issues, and opportunities for improvement. Log analytics is important because it enables organizations to quickly and effectively identify potential issues and respond to them in real-time, thereby reducing the risk of downtime and loss of data. This can also help organizations optimize their operations, improve performance, and gain insights into their technology stack to make informed decisions.
| Tested versions | |
| ECS compliant |
You must log in to submit a review.