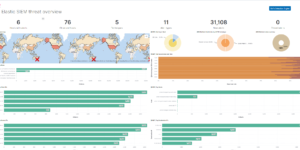
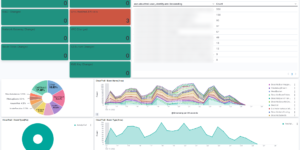
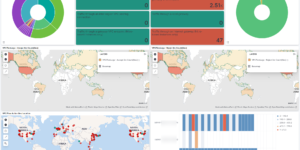
Description
This is a Logstash Pipeline to load logs from Cisco Meraki into Elasticsearch. Note that the recommended way to load Cisco Meraki Logs into Elasticsearch is using the Cisco Meraki Filebeat module.
It includes Logstash pipelines for
- urls
- flow
- content filtering
- ids
- eap authentication
What is Cisco Meraki?
Cisco Meraki is a cloud-managed IT company headquartered in San Francisco, California. Their products include wireless, switching, security, enterprise mobility management (EMM) and security cameras, all centrally managed from the web.
The Meraki cloud is the backbone of the highly available, secure and efficient Meraki solution, enabling instant onboarding access to all features inside the Meraki dashboard. It is comprised of highly-reliable servers at various data centers around the world. The Meraki dashboard itself is a centralized, web browser-based tool used to monitor and configure Meraki devices and services. A dashboard account is what you use to log in to the dashboard in order to manage and configure your organizations, networks, and devices.
It is important to note that “organization” and “network” in this sense are from the perspective of the dashboard. In the Meraki dashboard, an “organization” is a logical container for Meraki networks managed by one or more accounts. A dashboard “network”, on the other hand, is logical container for a set of centrally managed Meraki devices and services. Devices go in a network; networks go in an organization; organizations are managed by user accounts from the Meraki dashboard; all of this information, as well as device configuration settings, is stored in the Meraki cloud.
Source
This was originally found here: https://github.com/dainperkins/Elastic-ECS-SIEM/tree/master/Meraki
| Tested versions | 7.12 |
| ECS compliant |
You must log in to submit a review.


