Sankey visualization

Description

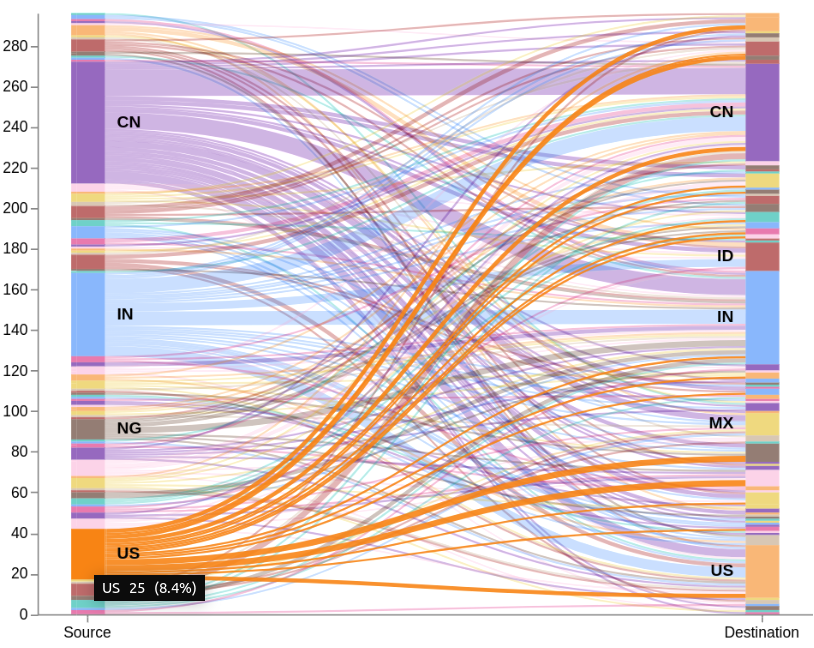
This is an example of how to build an sankey visualization using the vega visualization in Kibana. This vega example has three versions of the sankey visualization. Its an 2 Level, 4 Level and 7 Level example. A Sankey visualization is a great way to show the movement of users through your application. It can also be used for any other kind of data representation that is based on multiple levels and each level has an defined start and ending point.

A Sankey chart is a kind of stream chart with the width of the lines shown relatively to the stream amount. Every passage in the example information has source and objective nation code. The chart will have two modes: all-to-all (default), in addition to it will permit clients to choose either the source or the objective nation, and show just related traffic.

Remarks

This download is not able to run immediately. But its easy to adapt to your needs. You only need to change the index to search in and also the fields that contain the source and the destination information.

Make sure source and destination contain similar values to make it work.

Source

If you wanna learn more about that check this blog which is the source for that example:

https://www.elastic.co/de/blog/sankey-visualization-with-vega-in-kibana

Tested versions
ECS compliant

You must log in to submit a review.

Related downloads

Logstash REST to exec scripts

Make Logstash a REST endpoint that executes scripts or manually adds data in Elasticsearch.

Watch for changes in IOWaits

A watch which alerts if the time spent by a hosts CPU in IOWait, has increased by more than than N% in the last Y mins.

Watch to detect large shards

This watch is getting data from the Elasticsearch shards API directly and checking for large shards.

Sankey visualization example

This is an example of how to build an sankey visualization using the vega visualization in Kibana.

Office 365 dashboards

A collection of Kibana dashboards to provide a holistic view of Microsoft Office 365 environments

Google Cloud monitoring dashboard

Dashboard to monitor GCP resources using different metrics and logs.

These downloads could be also interesting for you

Traffic light using Vega

This traffic light visualizations is build with vega. The thresholds can be defined via values within the document itself.

Sigma Windows inbuilt detection rules

A collection of rules based on the Sigma rules for Windows (inbuilt folder) based on Winlogbeat data .

Kibana Canvas examples collection

Average rating:

A collection of canvas examples, like using conditionals, creating buttons, animations or context menues. Just copy paste into your Kibana Canvas project.

Google Cloud Log Ingestion dashboard

Canvas Board to analyze the log data collection of Google Cloud via Dataflow using the Google Cloud Metric module data

Vega Compound Gauge

This is a compund gauge visualization made with Vega. Its very helpful for visualization of percentage values.

Sigma Sysmon detection rules

A collection of rules based on the Sigma detection rules for Windows Sysmon events based on Winlogbeat data.