Kibana Downloads

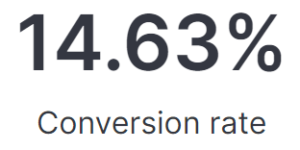
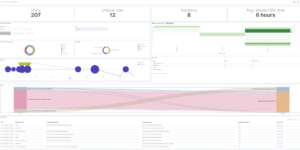
With this vega traffic light visualization you can build very dynamic traffic lights.

This example is made to show how to use document values to determine the threshold for switching colors from red to green. It also shows how to link to other objects by clicking on the traffic light.

Pretty easy but pretty useful. There are also other ways to build traffic lights within Kibana but this is the most flexible one.

Tested versions 6.x, 7.x
ECS compliant

You must log in to submit a review.

Related downloads

CMDB dependency in Kibana Dashboard

Kibana vega example to show how to load visualize relationships between different infrastructure and network components in vega.

Logstash Pipeline for Talend ESB & MDM

A Logstash Pipeline to collect json logs from Talend ESB & MDM.

Detection engine alerts overview dashboard

Average rating:

Kibana Canvas dashboard that shows an aggregated view on the results of the detection engine in Elastic Security.

Kibana Maps with Open Weather Map

This is the default basemap of Kibana incl. the Open Weather Map tile for temperature, wind and pressure

Sigma detection rules for proxy server logs

A collection of rules based on the Sigma detection rules for proxy server and web server looks, e.g. zeek or suricata.

These downloads could be also interesting for you

Cloudflare Kibana dashboards

Cloudflare dashboards and ingest pipelines to visualize cloudflare logs

Elastic Cloud Billing data collection and Kibana dashboard

Pulls Elastic Cloud Billing information from the Billing API then sends it to an Elasticsearch cluster and visualizes the results in Kibana dashboards.

PI Hole Logstash Pipeline and Dashboard

A filter for Logstash parsing PI-Hole logs + Dashboard to visualize the data

Kubernetes architecture overview

Vega visualization to show the dependencies between the different Kubernetes components in a single visualization

Sigma Sysmon detection rules

A collection of rules based on the Sigma detection rules for Windows Sysmon events based on Winlogbeat data.

Vega advanced heat map

Vega example to show GitHub commits per author per hour of day.