Kibana Downloads

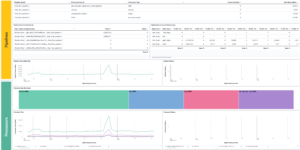
With this vega traffic light visualization you can build very dynamic traffic lights.

This example is made to show how to use document values to determine the threshold for switching colors from red to green. It also shows how to link to other objects by clicking on the traffic light.

Pretty easy but pretty useful. There are also other ways to build traffic lights within Kibana but this is the most flexible one.

Tested versions 6.x, 7.x
ECS compliant

You must log in to submit a review.

Related downloads

Microsoft 365 Dashboards for Elastic

Visualize your Microsoft 365 data in Kibana.

ACSC Advisory IOCs detection rules

ACSC Advisory IOCs detection rules for Elastic SIEM

Resource Optimization Dashboard

Elastic Resource Optimization Dashboard to seamlessly integrate APM insights with cloud cost data for actionable resource management and cost-saving strategies

Logstash Meraki Pipeline

Logstash Pipeline to load Meraki logs via Syslog into Elasticsearch

Spring Boot Micrometer Dashboard

Monitor Spring Boot applications using Micrometer metrics.

Office 365 dashboards

A collection of Kibana dashboards to provide a holistic view of Microsoft Office 365 environments

These downloads could be also interesting for you

Office display canvas example

Kibana canvas example showing an office screen with weather, news and stock information

Coffee Canvas Example

Kibana Canvas example infographic to show coffee consumption on a wallboard

Cloudflare Kibana dashboards

Cloudflare dashboards and ingest pipelines to visualize cloudflare logs

CMDB dependency in Kibana Dashboard

Kibana vega example to show how to load visualize relationships between different infrastructure and network components in vega.

Traffic light using Vega

This traffic light visualizations is build with vega. The thresholds can be defined via values within the document itself.

Vega Scatterplot Kibana visualization

A scatterplot visualization made with Vega Lite for Kibana