Kibana Downloads

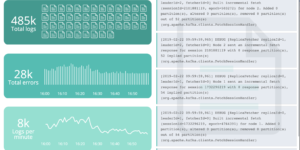
With this vega traffic light visualization you can build very dynamic traffic lights.

This example is made to show how to use document values to determine the threshold for switching colors from red to green. It also shows how to link to other objects by clicking on the traffic light.

Pretty easy but pretty useful. There are also other ways to build traffic lights within Kibana but this is the most flexible one.

Tested versions 6.x, 7.x
ECS compliant

You must log in to submit a review.

Related downloads

Kibana Enhanced Table plugin

Data Table visualization with enhanced features like computed columns, pivot table or filter bar

AWS Cloudtrail Monitoring dashboard

Deep insights into AWS Cloudtrail events for SIEM and Monitoring

OpenSIEM Logstash Parsing

Logstash Parsing Configurations for Elastic SIEM parses many different sources into ECS

Observability Kibana Dashboard

A single pane of glass dashboard for Logs, Metrics, APM data and business KPIs.

Threat detection Kibana dashboard

Kibana dashboard example visualizing the results of the Elastic SIEM detection engine

Lens Conversion Rate

Lens conversion rate for RUM data using Lens Formulas

These downloads could be also interesting for you

Sigma detection rules for proxy server logs

A collection of rules based on the Sigma detection rules for proxy server and web server looks, e.g. zeek or suricata.

Kibana alerting enhancement

This bundle enhances the Kibana alerting experience. Storing all relevant information in indices and visualize the data in dashboards.

Filebeat Suricata Canvas dashboard

A Kibana Canvas dashboard example that visualizes suricata logs collected with Filebeat.

Elasticsearch Performance Troubleshooting Kit

Download the Elasticsearch Performance Troubleshooting Kit to efficiently diagnose and resolve slow query issues in your Elasticsearch environment.

Sigma Windows Process Creation detection rules

A collection of rules based on the Sigma rules for Windows (process creation folder) based on Winlogbeat data .

Google Cloud Log Ingestion dashboard

Canvas Board to analyze the log data collection of Google Cloud via Dataflow using the Google Cloud Metric module data