Kibana Downloads

With this vega traffic light visualization you can build very dynamic traffic lights.

This example is made to show how to use document values to determine the threshold for switching colors from red to green. It also shows how to link to other objects by clicking on the traffic light.

Pretty easy but pretty useful. There are also other ways to build traffic lights within Kibana but this is the most flexible one.

Tested versions 6.x, 7.x
ECS compliant

You must log in to submit a review.

Related downloads

Watch to detect large shards

This watch is getting data from the Elasticsearch shards API directly and checking for large shards.

Watcher job to integrate ChatGPT in Elasticsearch

Watcher job to integrate ChatGPT API from OpenAI in Elasticsearch. Helpful to find solutions for error messages very quick.

Traffic light using Vega

This traffic light visualizations is build with vega. The thresholds can be defined via values within the document itself.

Uptime watch using Heartbeat data

This watch checks the availability of your Heartbeat observed services. It will trigger an alert whenever at least one of your services is down.

PI Hole Logstash Pipeline and Dashboard

A filter for Logstash parsing PI-Hole logs + Dashboard to visualize the data

Sigma Elastic SIEM rules for web server logs

A collection of rules based on the Sigma detection rules for web server looks, e.g. apache, nginx or IIS.

These downloads could be also interesting for you

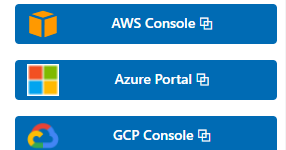
Buttons for Kibana dashboards

Link to every content you want within your Kibana dashboards. This example is using links to cloud providers.

Kibana Canvas examples collection

Average rating:

A collection of canvas examples, like using conditionals, creating buttons, animations or context menues. Just copy paste into your Kibana Canvas project.

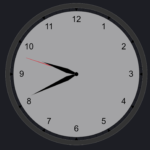
Vega Clock UTC

This is a working clock visualization in UTC time.

Traffic light using Vega

This traffic light visualizations is build with vega. The thresholds can be defined via values within the document itself.

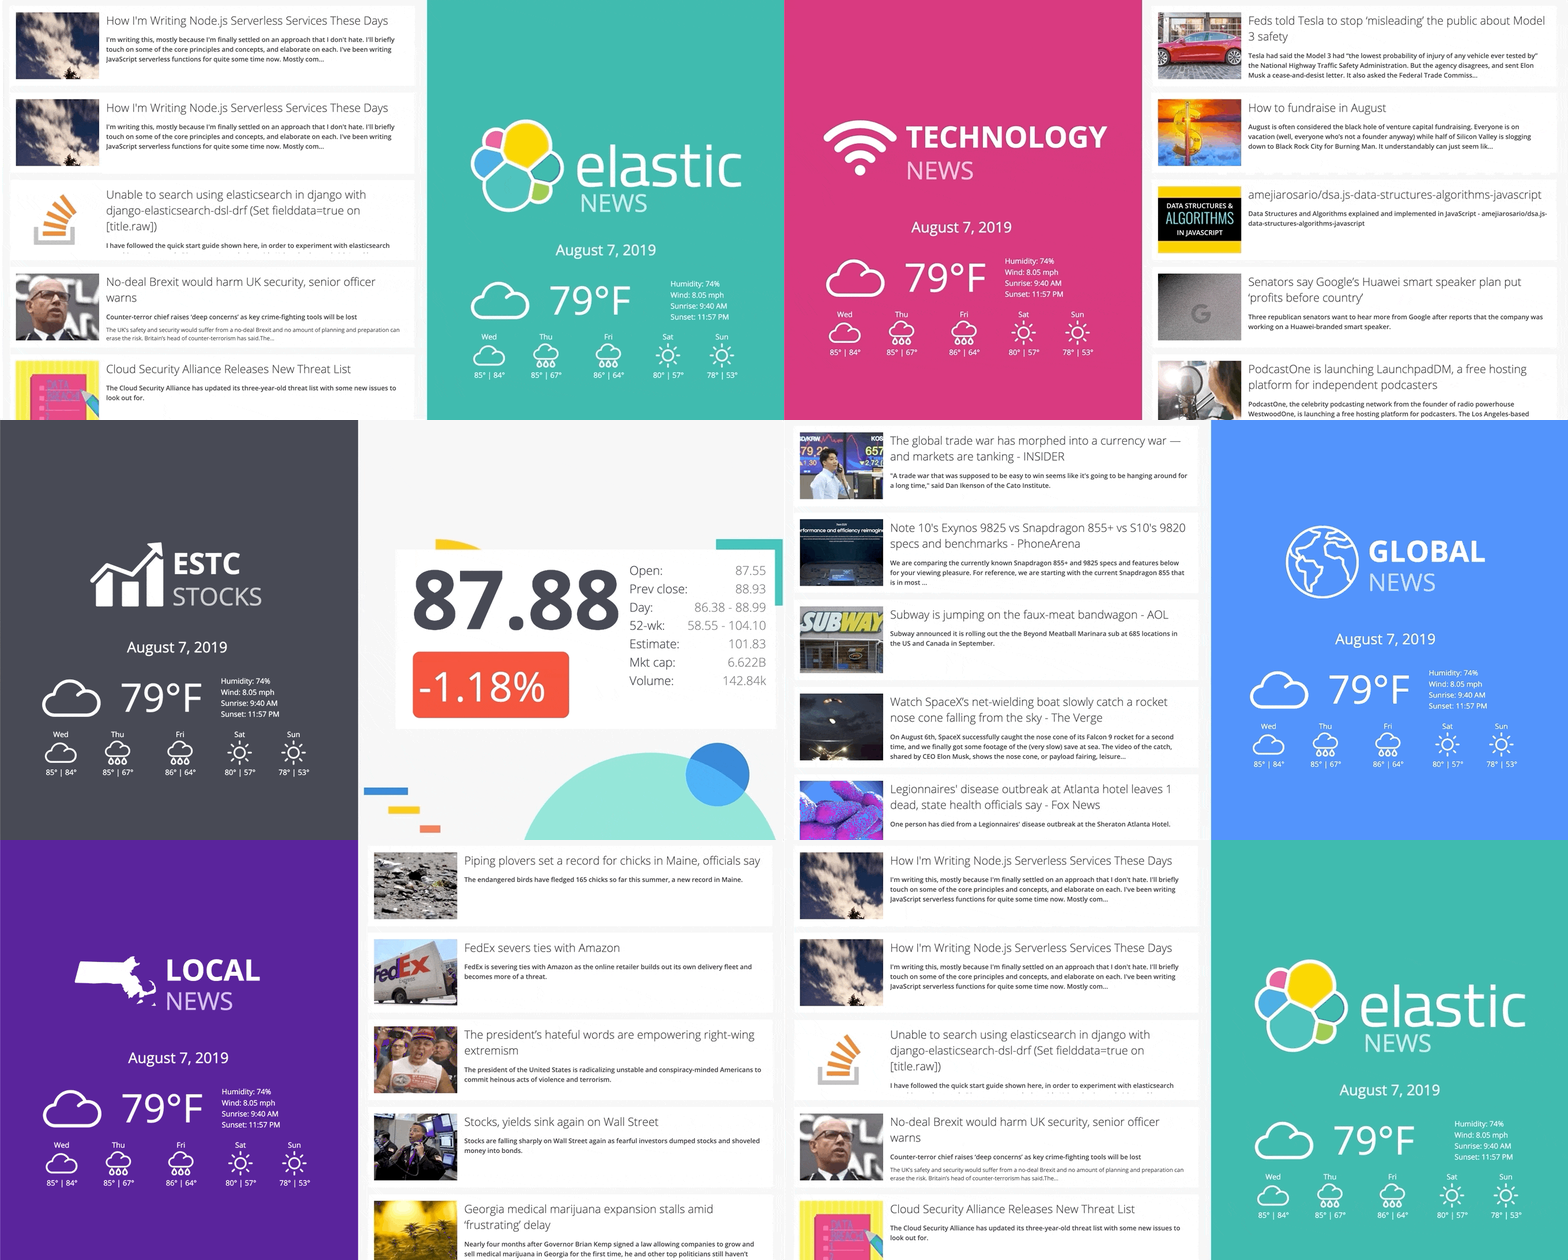
Office display canvas example

Kibana canvas example showing an office screen with weather, news and stock information

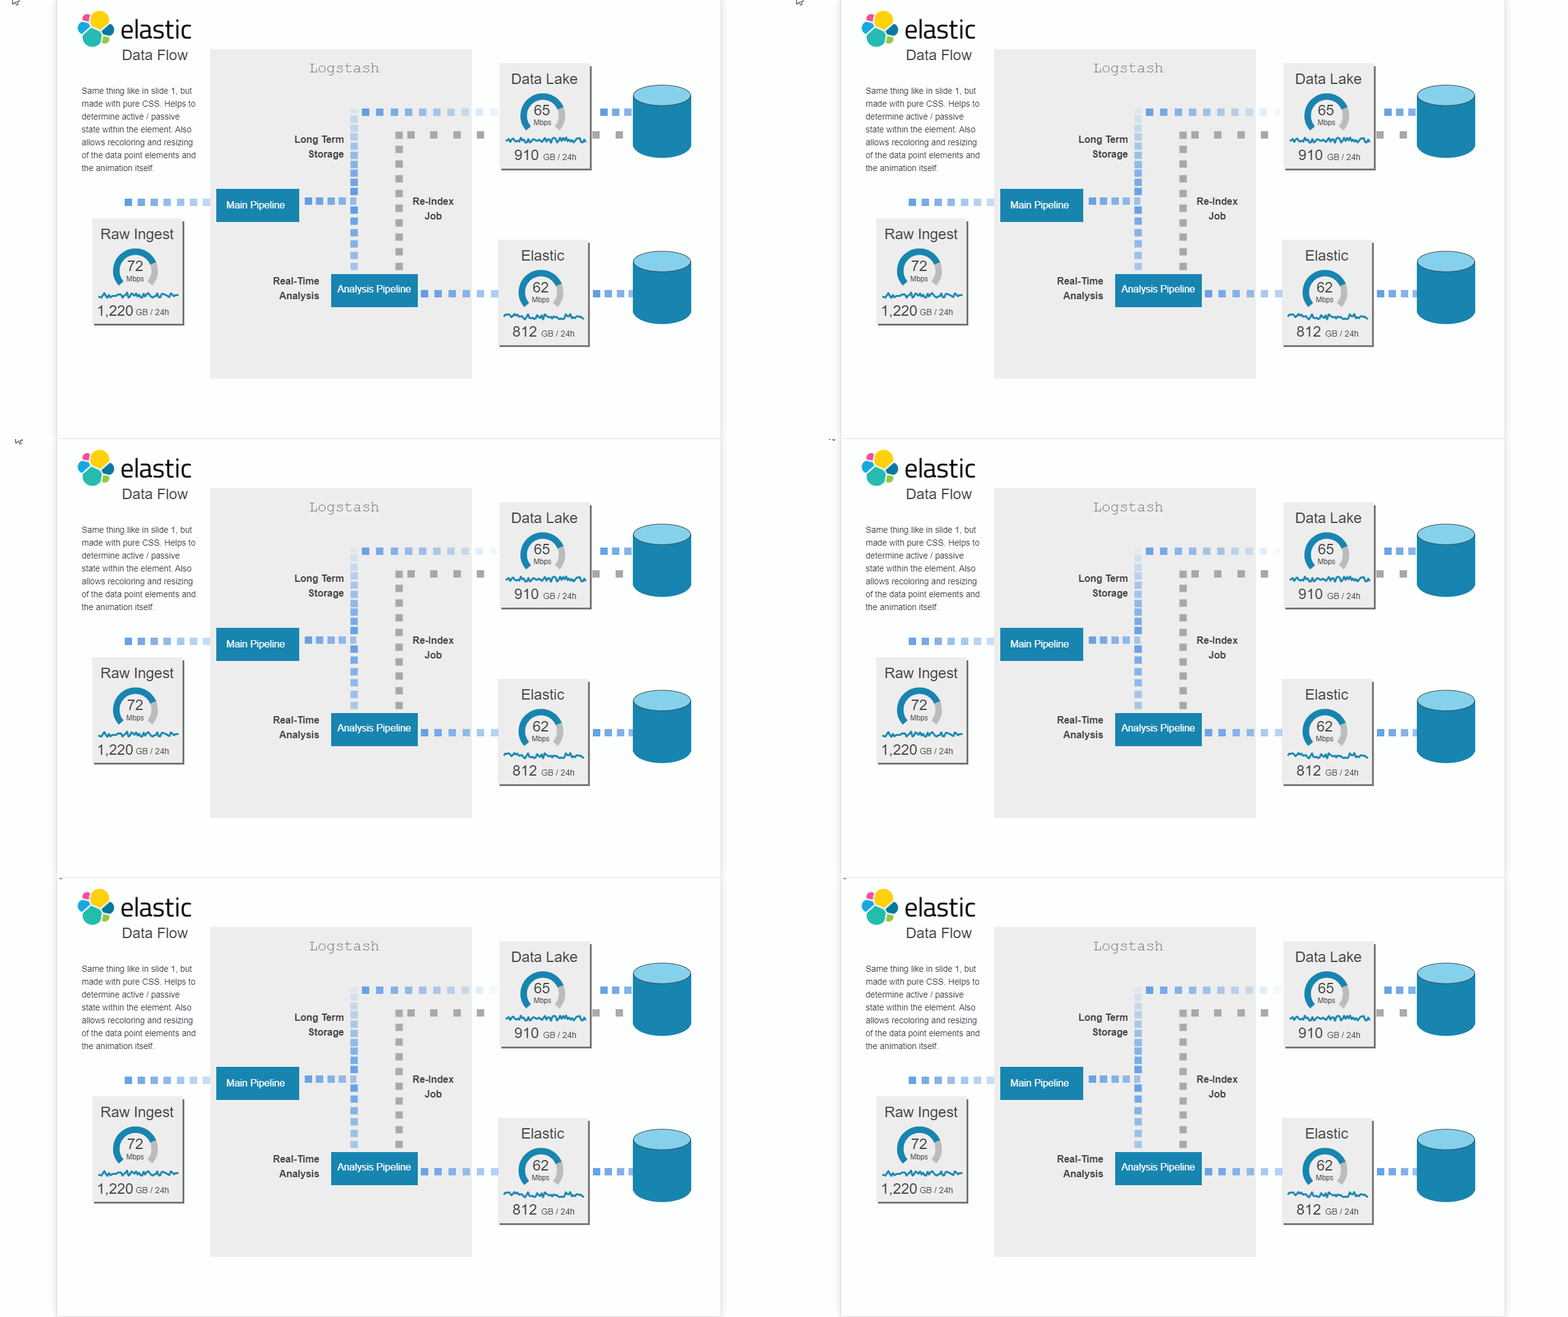
Data flow canvas

Average rating:

This canvas examples shows some possibilities of how to visualize data flows. Every flow can be activated / deactivated based on your Elasticsearch data.