Microsoft 365 Dashboards

Gain insights into your Microsoft 365 environment with these Kibana dashboards.
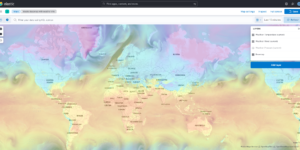
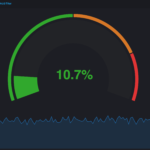
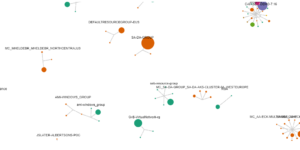
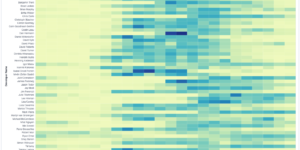
Designed to work with the Elastic M365 integration, they provide visualizations for:

  • Exchange Online: Mail traffic, user activity.
  • SharePoint & OneDrive: File operations and user interactions.
  • Teams: Usage and activity metrics.
  • Azure AD: Sign-in logs and audit events.

Contents: Single NDJSON file containing the dashboard objects.

Source: eric-ooi/elastic-m365

Tested versions
ECS compliant

You must log in to submit a review.

Related downloads

APM Services overview canvas

Average rating:

An adaptive turn key canvas example based on Elastic APM data.

Resource Optimization Dashboard

Elastic Resource Optimization Dashboard to seamlessly integrate APM insights with cloud cost data for actionable resource management and cost-saving strategies

Filebeat Suricata Canvas dashboard

A Kibana Canvas dashboard example that visualizes suricata logs collected with Filebeat.

Kibana Maps with Open Weather Map

This is the default basemap of Kibana incl. the Open Weather Map tile for temperature, wind and pressure

Logstash Meraki Pipeline

Logstash Pipeline to load Meraki logs via Syslog into Elasticsearch

Postfix Mail Server Dashboard

Monitor Postfix mail server logs with Kibana.

These downloads could be also interesting for you

Sigma Zeek Detection rules

A collection of rules based on the Sigma rules for Zeek based on the Filebeat Zeek module.

Coffee Canvas Example

Kibana Canvas example infographic to show coffee consumption on a wallboard

Watch for changes in IOWaits

A watch which alerts if the time spent by a hosts CPU in IOWait, has increased by more than than N% in the last Y mins.

Vega Compound Gauge

This is a compund gauge visualization made with Vega. Its very helpful for visualization of percentage values.

Sigma Windows Process Creation detection rules

A collection of rules based on the Sigma rules for Windows (process creation folder) based on Winlogbeat data .