Kibana Crawler dashboard

Description

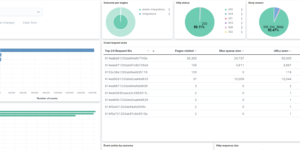
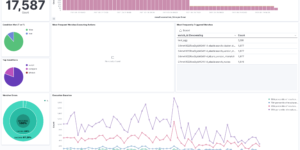
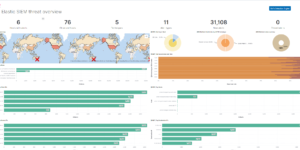
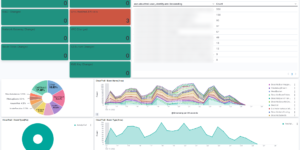
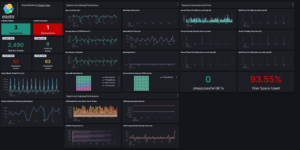
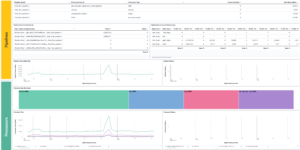
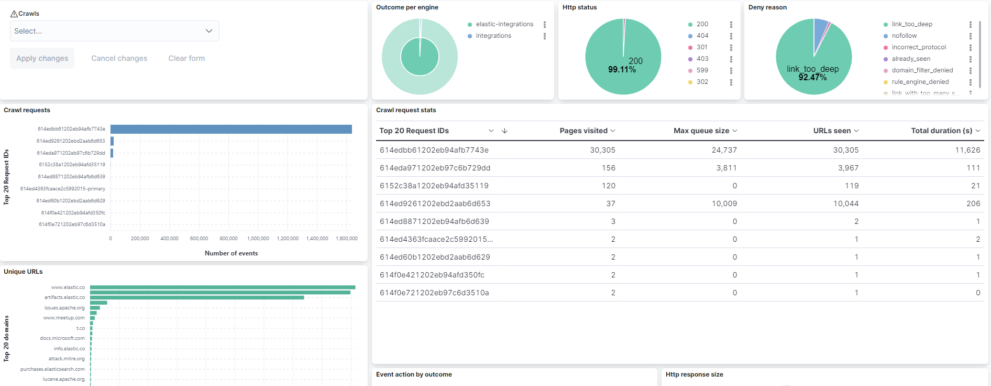
This is a Kibana dashboard that visualizes the results of the crawler from Elastic Enterprise Search. The Web Crawler of Elastic gone GA in 7.15 and can be used to index webpages into App Search. After ingesting you can easily embed a search box into your application.

The crawler job can take a while and is doing a lot of things under the hood. It is saving all the details and logs in an internal index. However Elastic allows the user to use the data for custom Kibana dashboards.

Tested versions 7.14
ECS compliant Yes

You must log in to submit a review.

Related downloads

Kibana alerting enhancement

This bundle enhances the Kibana alerting experience. Storing all relevant information in indices and visualize the data in dashboards.

Elastic Cloud Billing data collection and Kibana dashboard

Pulls Elastic Cloud Billing information from the Billing API then sends it to an Elasticsearch cluster and visualizes the results in Kibana dashboards.

Threat detection Kibana dashboard

Kibana dashboard example visualizing the results of the Elastic SIEM detection engine

Ingest Pipeline Monitoring

This Kibana dashboard can be used monitor your ingest pipelines

Ask Me Anything Booth – Canvas Example

This is an example canvas page that shows how to visualize using canvas in general.

Office 365 dashboards

A collection of Kibana dashboards to provide a holistic view of Microsoft Office 365 environments

These downloads could be also interesting for you

Elasticsearch Performance Troubleshooting Kit

Download the Elasticsearch Performance Troubleshooting Kit to efficiently diagnose and resolve slow query issues in your Elasticsearch environment.

Threat detection Kibana dashboard

Kibana dashboard example visualizing the results of the Elastic SIEM detection engine

Office 365 dashboards

A collection of Kibana dashboards to provide a holistic view of Microsoft Office 365 environments

RUM extension dashboard

This dashboard provide deeper insight into the real user monitoring data collected by Elastic RUM.

Detection engine alerts overview dashboard

Average rating:

Kibana Canvas dashboard that shows an aggregated view on the results of the detection engine in Elastic Security.

Timetable canvas

This canvas examples shows timetable data from trains. Its build based on the real world information panel in german trian stations. Its refreshing based on current time.