Elastic Stack Monitoring

The Elastic Stack (formerly known as ELK stack) is a very powerful tool for any kind of Search, Monitoring or Security Use Case. Therefore using the stack to monitor itself is a low hanging fruit. The recommended setup is to use the separate Self Monitoring cluster for this purpose.

Elastic comes with a lot of inbuilt monitoring capabilities. The Elastic Agent as well as the Beats do have integrations / modules to collect the necessary data. By using the Elastic Cloud the self monitoring can be activated for any cluster.

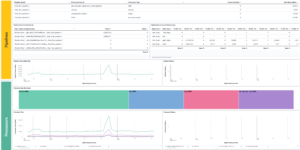
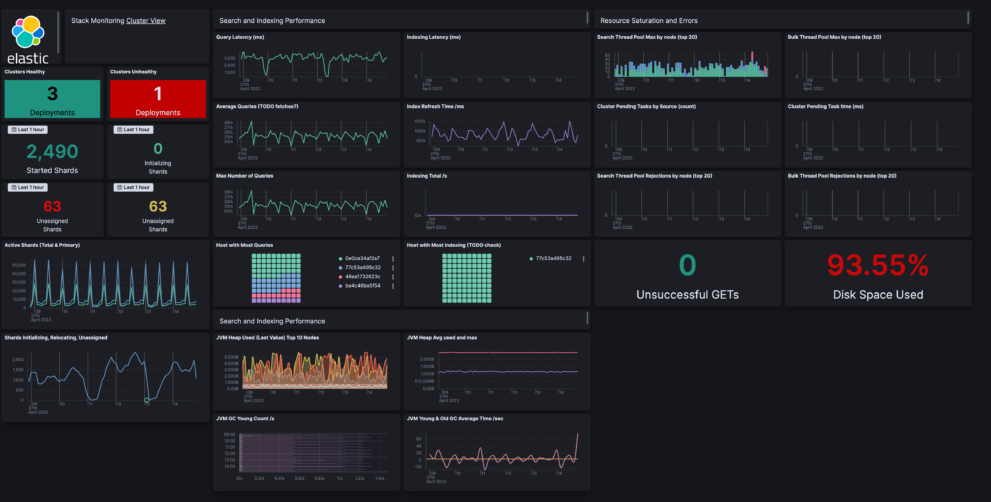
Nevertheless using the inbuilt monitoring app can be very helpful. But if a user has already a separate cluster to monitor the production cluster it makes sense to use all available capabilities also for that. Thats the reason we have Elasticsearch Monitoring dashboards as an extension to the normal behavior like this one.

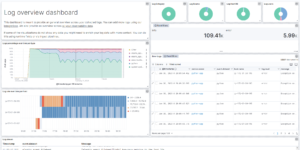
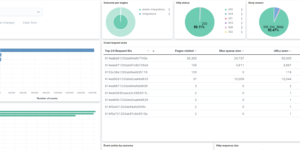
This Elastic Stack Monitoring Dashboard includes the following components:

  1. Create 2 index patterns / data views
  2. Create 1 transform
  3. Create Dashboard from ndjson file

Source: https://github.com/jeffvestal/elastic-stack-monitoring-dashboard

Tested versions 8.x
ECS compliant Yes

You must log in to submit a review.

Related downloads

Kubernetes architecture overview

Vega visualization to show the dependencies between the different Kubernetes components in a single visualization

Vega Clock UTC

This is a working clock visualization in UTC time.

Cloudflare Kibana dashboards

Cloudflare dashboards and ingest pipelines to visualize cloudflare logs

Sigma Elastic SIEM rules for web server logs

A collection of rules based on the Sigma detection rules for web server looks, e.g. apache, nginx or IIS.

Filebeat Suricata Canvas dashboard

A Kibana Canvas dashboard example that visualizes suricata logs collected with Filebeat.

Filebeat Log analysis canvas example

This is a simple canvas dashboard example that analyzes logs created by Filebeat.

These downloads could be also interesting for you

Detection engine alerts overview dashboard

Average rating:

Kibana Canvas dashboard that shows an aggregated view on the results of the detection engine in Elastic Security.

Watcher History Dashboard

This dashboard shows the history of executed watcher jobs.

Kubernetes architecture overview

Vega visualization to show the dependencies between the different Kubernetes components in a single visualization

PI Hole Logstash Pipeline and Dashboard

A filter for Logstash parsing PI-Hole logs + Dashboard to visualize the data

Threat detection Kibana dashboard

Kibana dashboard example visualizing the results of the Elastic SIEM detection engine

Office display canvas example

Kibana canvas example showing an office screen with weather, news and stock information